Documentation Home Page ◇ HYPERSIM Home Page
Pour la documentation en FRANÇAIS, utilisez l'outil de traduction de votre navigateur Chrome, Edge ou Safari. Voir un exemple.
ScopeView | Advanced Graphic Actions
ScopeView enables you to execute many graphic actions on one or many graphs on the current page. These actions are intended to facilitate analyzing the results.
The Advanced Graphic Actions are:
- Superimposition
- Undo superimposition
- Cursor
- Tracking cursor
- Select Signals
- Plot signals
Superimposition
In order to provide a simple way of comparing curves, you can superimpose them on the same graph. Moreover, ScopeView saves all the superimpositions made to revert to each of the previous acquisitions.
To execute a Superimposition, click on the graph(s) of interest then click the button in the toolbar. The selected graphs will superimpose automatically.
Superimposition is also available in the ScopeView – Signals window.
If the graphs of interest do not have the same X display range, ScopeView then uses the union of these ranges, in other words, the minimum lower delimiter and the upper maximum delimiter of all the graphs to superpose.
A different color and type of trace are used to set apart each of the superimposed curves. A legend at the top of the graph identifies each curve.
When executing a superimposition, the selected graphs are hidden and the resulting graph is displayed at the position of the first selected graph.
Undo Superimposition
The undo option of the Graph menu allows you to cancel the superimposition and return to the initial configuration.
To revert from a superimposition of graphs, select the graph of interest then click the button in the toolbar. The selected graph will revert to their original state automatically.
The “revert” superimposition is also available in the ScopeView – Signals window.
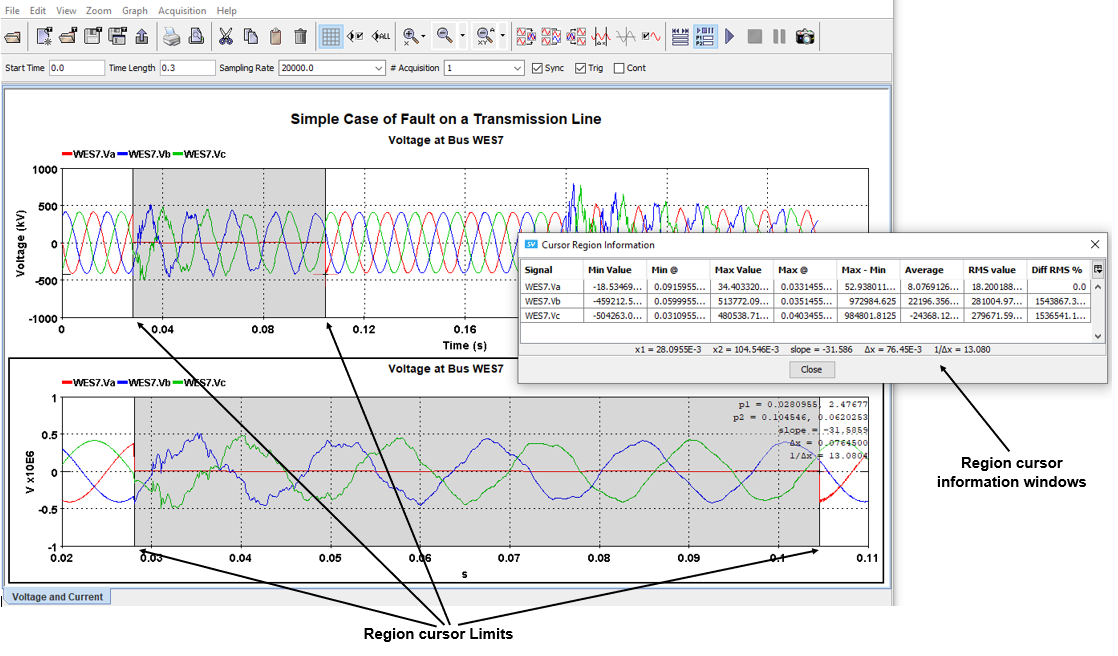
Cursor
The Cursor, or the region cursor, allows the user to delimit a region of interest on the graph and display a pop-up result window. This function is very useful to compare a wider range of information, particularly in superimposed graphs, than with the tracking cursor. The tracking cursor displays results in an information window.
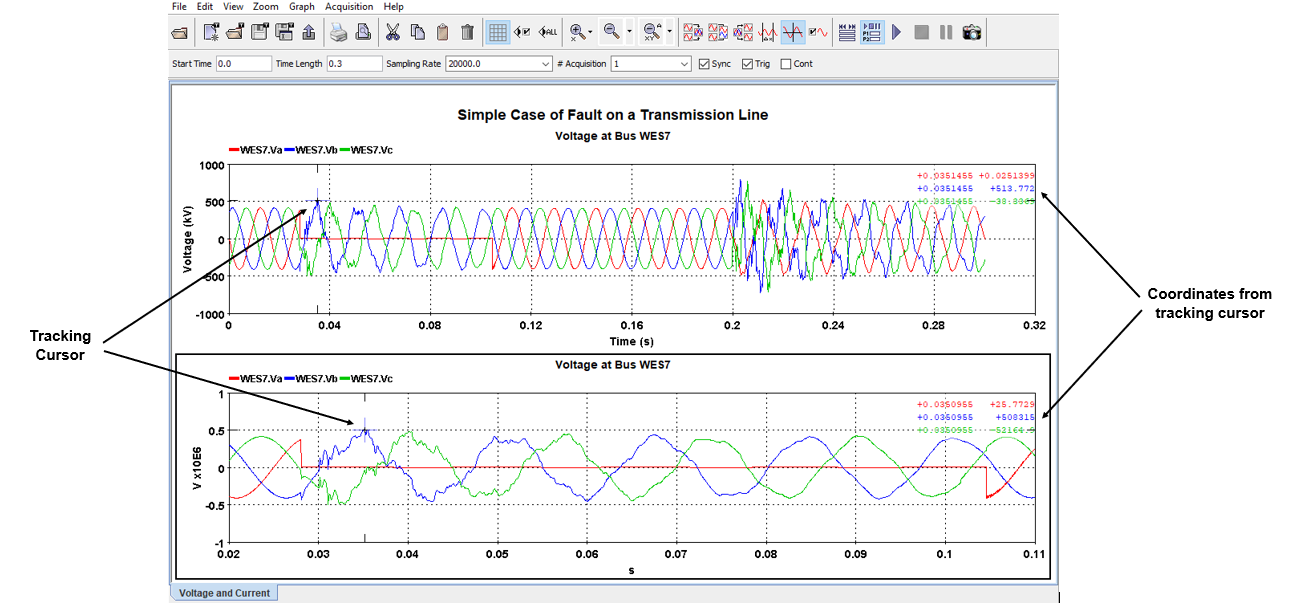
Tracking Cursor
With the tracking cursor, ScopeView gives you the possibility of measuring signals displayed on the graphic page.
To switch to the tracking mode, click the cross-hair cursor icon in the toolbar. ScopeView displays the Tracking cursor on all graphs selected on the graphic page
To switch off the tracking mode click the cross-hair cursor icon again. It has a toggle action.
It also displays, on the status line, the coordinates of the current point of each curve (simultaneously above each graph). ScopeView updates instantaneously the coordinates when the cursor moves.
In tracking mode, you can:
Move the cursor by moving the mouse laterally. A lateral displacement brings about the automatic positioning of the horizontal line on the current point.
The intersection of the vertical line with the horizontal line indicates the position of the point whose coordinates are displayed on the status line.
- Use the LEFT or RIGHT arrow keys to move from one point to another on the curve.
- Use the UP or DOWN arrow keys or the space bar to move the cursor from one curve to another (superimposition).
For the selection and plotting of signals, see ScopeView | Signals Form Menu, Data Source Chooser & Signal Selection
Data Management
Exporting Results
Users can transfer a result file in a different format to be used with simulation software or in a convenient format for visualization or printing purposes. Available formats are:
- Comtrade (*.cfg)
- Encapsulated PostScript (EPS) (*.eps);
- Joint Photographic Expert Group (*.jpg)
- MATLAB Binary (*.mat);
- Portable Document Format (PDF) (*.pdf);
- Portable Network Graphic (*.png);
- PostScript (PS) (*.ps);
- Text (tab separator) (*.txt).
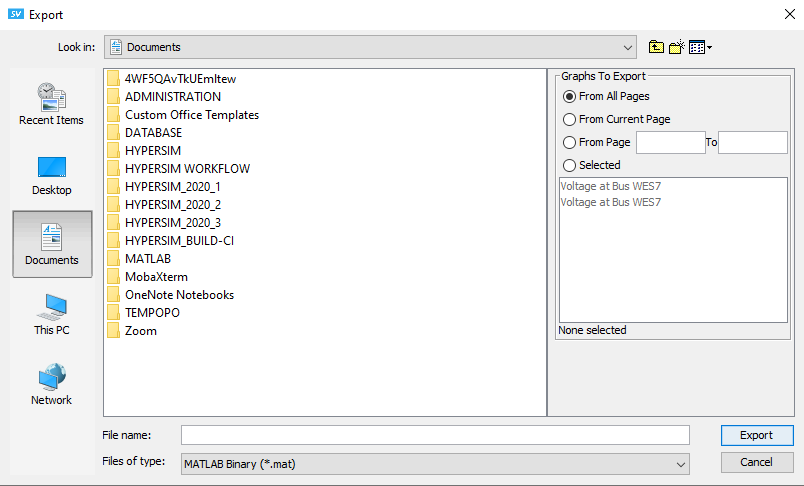
To export a result file:
- Click the Export button at the top of the window
- Type in the file name
- Then select the file format
- Click the Export button.
Printing
The Print button in the main window is used to print the content of the graphic page with a PostScript laser printer, or to a PostScript format file.
It is possible to change the printer or the print orientation by modifying the items on the Print Options form.
To access the Print Options form, click the print button or click the print option from the File menu
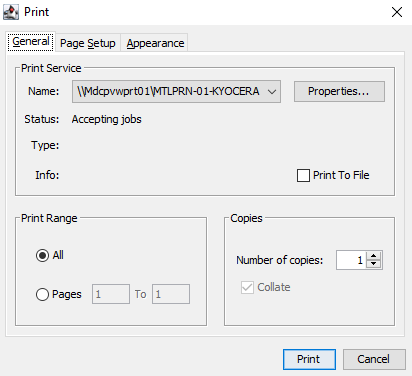
Select the desired options.
In accordance with the printer installed on your system, select the desired options from the General, Page set-up and Appearance tabs.
Each printer and system have different options like color output, A4 or A3 paper size, etc. It is up to the user to set his printer. ScopeView on Personal Computer (PC) uses the MS Windows drivers.
OPAL-RT TECHNOLOGIES, Inc. | 1751, rue Richardson, bureau 1060 | Montréal, Québec Canada H3K 1G6 | opal-rt.com | +1 514-935-2323