Documentation Home Page ◇ HYPERSIM Home Page
Pour la documentation en FRANÇAIS, utilisez l'outil de traduction de votre navigateur Chrome, Edge ou Safari. Voir un exemple.
ScopeView | Signal Processing
Signal Processing
Below the Available Signals area, six cells and one button are present.
Signal Selection Mode
- Single: Any selected (mouse click) signal will move automatically to the Selected signals list.
- Multiple: Click the signals you want then click the Add Signals button to add signals to the Selected Signals. Multiple selections are possible by clicking and holding the CTRL-key.
- The Add Signals button shows only when the multiple option is selected.
Graph Creation
- Normal: ScopeView displays one signal per graph.
- Superimposed: ScopeView displays two or more traces in the same graph (depending on how many signals you have selected.
| X AXIS | Grid or Log | ScopeView displays, according to the ticked box, either a graph with/without a grid. The other option displays a linear/logarithmic graph on the X-axis. |
Y AXIS | Grid or Log | ScopeView displays, according to the ticked box, either a graph with/without a grid. The other option displays a linear/logarithmic graph on the Y-axis. |
| DATA | Auto Load | ScopeView displays automatically the selected signal of a pre-recorded file data source. It's compatible with all formats except .oprec files. |
| PAGE | Select the page number to display the selected signal. |
| FUNCTION |
|
Selected Signals
This area shows all the selected signals and their description. The two right-hand columns are used to display or not the result on the page of your choice.
By default the Signal column displays and confirms the selection of different signals.
- To edit a signal, click on its cell, type in your changes and, hit <ENTER>. You must press <ENTER> to commit the changes or <ESC> to cancel. Either of these actions will return user to the default mode.
- The Description column shows the signal description (often the same as the signal name under the Signal column.
- The Show column, when “ticked” , the signal will be acquired and displayed in ScopeView.
- In the Page column, the number written under this column tells ScopeView on what page to display the result from that signal.
- The numbered column at the far left is used to show the background edit menu. Right-click the line you want to edit.
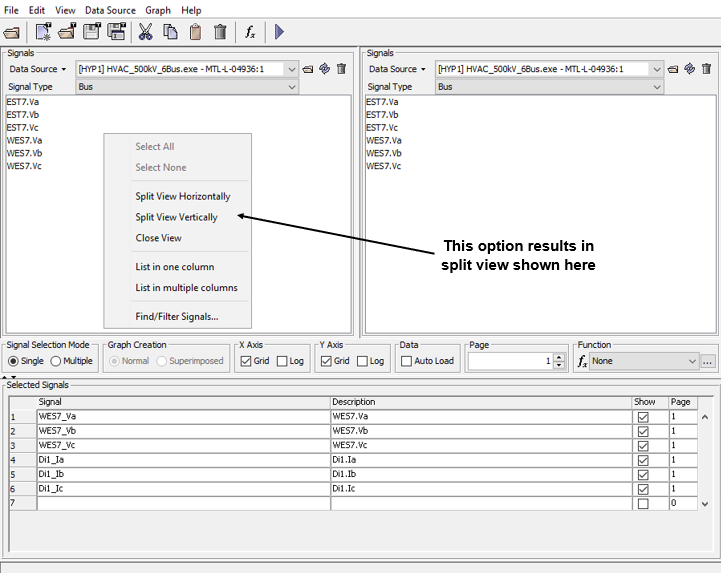
Split Screen Option
Scope View offers a split-screen option to ease the multiple data source use. Simply click the mouse in the Signals area to see the background menu. You can split the area either horizontally or vertically. To revert to a single screen, click on Close View. Below is an example of a horizontally split screen from the data sources loaded in two sections.
Removing a Source
The Remove button enables you to remove the current source or the Remove All button removes all the sources files from the scroll list.
To remove file(s) from the active list, display the source file you want to remove in the Loaded Data source file list;
Display the Data Source menu, and click on the Remove current data source item.
Or click on the Remove All button if desired.
If some formulas contain signals from a removed source, ScopeView displays a message asking to confirm this action. If you confirm, the formulas affected by the removal are automatically withdrawn from the list of formulas to evaluate.
Replacing a Source
The Replace button is used to change the characteristics of a source. This action is useful when you want to keep evaluating the same formulas, but with signals from a different source. The only restriction to replace a source is that the list of available signals should be the same.
- To replace a source, in the Signal Form window, display the Data source menu;
- Click on the source to change, select the Replace item.
ScopeView makes sure that the changes you make follow the replacement criteria. Otherwise, it refuses to execute the requested action.
inserting a Function
The Signals section allows you to insert a new signal or function to the list of Selected Signals to evaluate.
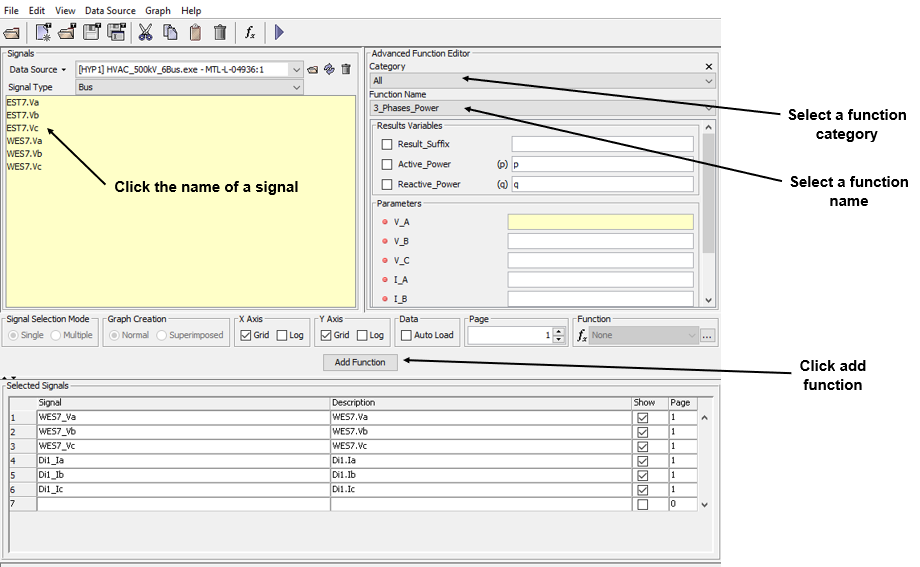
Advanced Functions
To apply an advanced function to a signal, click the name of the signal;
- Select the category of function you want to apply to a signal (or select All to see all the available functions;
- In the Function Name drop list, select a function;
- Click the Add Function button.
Simple Function
The Simple Function (far right of the ScopeView – Signals form) section allows you to specify the mathematical operations to apply to the signals you select in the list of available signals.
You can also configure other characteristics such as:
| abs | absolute value |
|---|---|
| acos | arc cosine |
| asin | arc sine |
| atan | arc tangent |
| cos | cosine |
| densp | spectral density |
| deriv | derivative |
| integ | integral |
| i2T | integral Time reverse sequence |
| log | logarithm |
| log10 | logarithm base 10 |
| min | minimum |
| max | maximum |
| moy | average |
| rms | root mean square |
| sin | sine |
| sqrt | square root |
| tan | tangent |
To apply a simple function to a signal, select the mathematical function to be applied to a signal using the menu related to the Function item.
Select a signal; Click Add Signals button.
List of Formulae to Evaluate
The Selected Signals area contains the list of formulas to evaluate during the acquisition. Each line in the list describes a signal (and a function in some cases) to evaluate and specifies characteristics such as:
- Description
- Show
- Page
Initially, ScopeView displays the results in a graphic page corresponding to their appearance order in the list of Selected Signals. After a first acquisition, you can change the display order by displacing the graphs interactively.
The Selected Signal field specifies a formula to evaluate. A new formula can be generated automatically by ScopeView or built manually.
To insert a new formula automatically, click the selected source in the Data Source list;
- Click the signal you want in the list of Signals
- Select the processing to be applied from the pull-down list under Function to apply
- To edit manually a formula, click in the Formula field of the formula to edit
- Type the formula
- If this formula reuses a signal from another formula, you can then enter manually the identifier that was assigned to it by ScopeView. However, if the formula contains signals, which are not yet part of other formulas, you must insert them as follows to allow ScopeView to assign an identifier to each new signal
- Click the selected source in the list of Data Sources
- Click the Multiple Signal Selection Mode and the function to be applied from the pull-down list under Simple Function to apply
- Click the name of the chosen signal in the list of Signals.
ScopeView has a formula interpreter to evaluate complex formulas. This interpreter supports the following operators and functions:
- Standard arithmetic operators (+, -, *, /, ** or ^, vs)
- Assigning in one or many variables that can be reused by other formulas
- Standard mathematical functions (sine, cosine, logarithm, etc.)
- Internal functions for spectral analysis (spectral density, frequency response, etc.)
- TYRAN functions (calculation of module and phase for a symmetric integral component, etc.
- External functions for signal processing (calculation of fundamental frequency, harmonics, digital filters, etc.
| DESCRIPTION | You can specify in the Description field the description to identify the result of the formula during graphic display. ScopeView automatically generates a default description when inserting a new formula. This description consists of an abbreviation representing the mathematical operation applied to the signal and the signal name (or signals) selected. |
| SHOW | The Show checkmark box specifies to ScopeView if it must display the formula result in a graph. ScopeView automatically selects this item when a signal or a function is inserted from the list of Signals. If you build manually a formula and you select this item, ScopeView will automatically initialize at 1 the Page field for the formula. You can change this page number if you wish. |
| PAGE | The Page field specifies the destination graphic page for the formula. |
Editing the List of Formulae
The list of signals can be edited to change the display order of the formulas or to delete them from the list.
You can edit the list of formulas either using the menu associated with the Edit menu, or the background menu associated with the scroll list. This menu allows executing the following commands:
- To select one signal only, click the far left column beside the required signal.
- Select all to select all the formulas.
- Select none to unselect all the formulas.
- Cut selected formulas and save them in the buffer
- Copy selected formulas in the buffer
- Paste to add to the list formulas from the buffer
- Delete remove selected formulas without affecting the content of the buffer
| CUT | To cut one or more formulas, move your cursor to the far left column and right-click to display the background menu. Click Cut. |
| COPY | To copy one or more formulas, move your cursor to the far left column and right-click to display the background menu. Select the Copy option from the Edit menu. |
| PASTE | To paste the content of the buffer, move your cursor to the far left column and right-click to display the background menu. Select to paste the contents of the buffer. |
| DELETE | To delete one or more formulas, move your cursor to the far left column and right-click to display the background menu. Select the Delete option from the background menu. |
OPAL-RT TECHNOLOGIES, Inc. | 1751, rue Richardson, bureau 1060 | Montréal, Québec Canada H3K 1G6 | opal-rt.com | +1 514-935-2323