Documentation Home Page ◇ HYPERSIM Home Page
Pour la documentation en FRANÇAIS, utilisez l'outil de traduction de votre navigateur Chrome, Edge ou Safari. Voir un exemple.
ScopeView | Main Window
Main Window
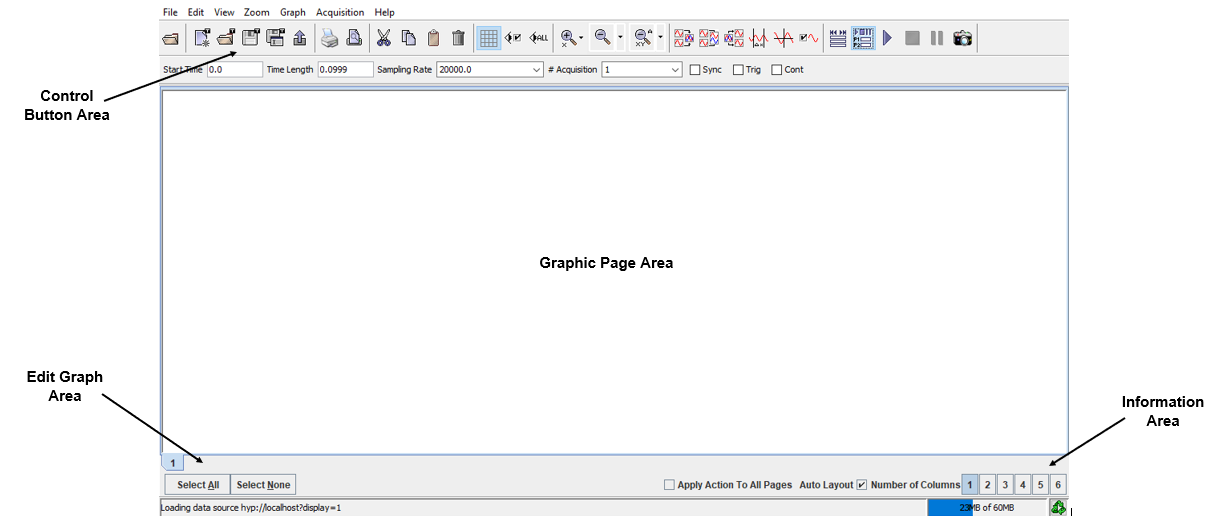
When ScopeView opens, the Signals form and the Main window are present on the screen. The ScopeView Signals form shows on top of the main window in order to first choose a source of signals and a template to be displayed by the Main window. The Main window is described in this document.
This section describes the major elements displayed in the main window of ScopeView.
For a clearer understanding, it is subdivided into different areas, described here.
- Control buttons area.
- Graphic page area.
- Edit graphs area.
- Information area.
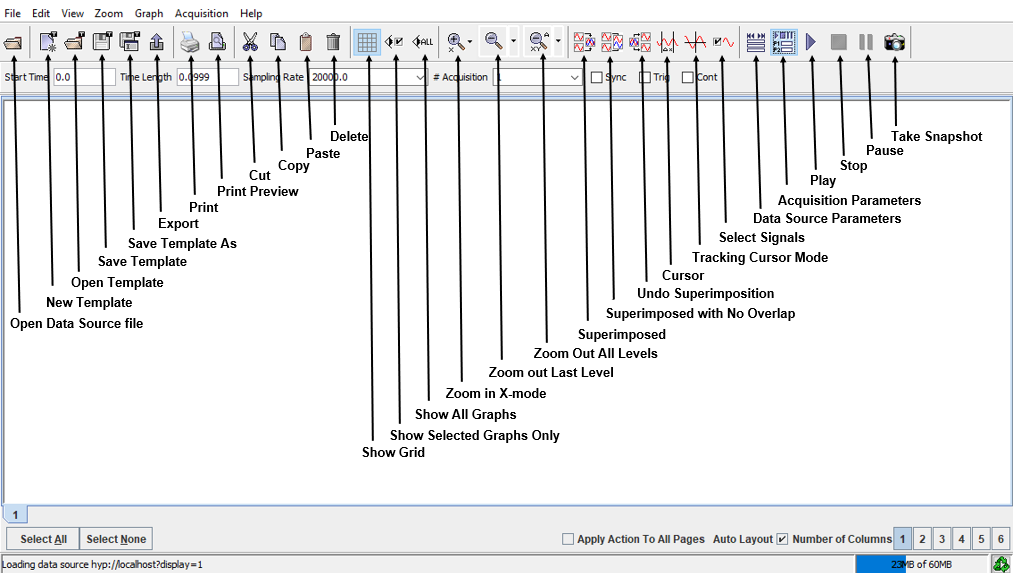
The two following figures give a brief description of each control button. The same shows a description that appears when you leave your mouse cursor on the chosen button.
Main Window Menus
File Menu
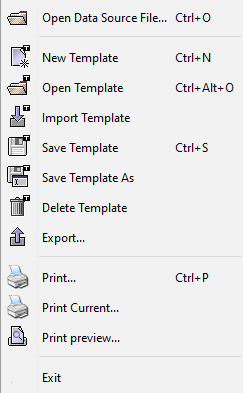
Open Data Source File...
Displays the window below. Select a file that was previously generated or select HYP to connect to a HYPERSIM model, TestView to connect to a TestView model.
Clicking Load loads the data source of interest.
For more on the Open Data Source File option, where users can select between File, HYPERSIM, TestView or Data Logger, see:
ScopeView | Signals Form Menu, Data Source Chooser & Signal Selection
NEW TEMPLATE | Clears the graphic page area to let you create your own new template. |
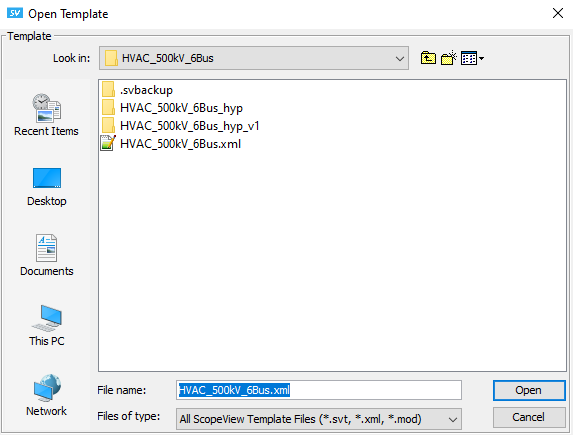
OPEN TEMPLATE | Allows the opening of a template used with another simulation session. Template files have.xml or.mod extension. The name of the template file appears at the top of the main window. |
| SAVE TEMPLATE | Saves a study set-up in a file for future use as a template or to help in setting up a new study in your current directory. The template is saved under ScopeView\templates\... |
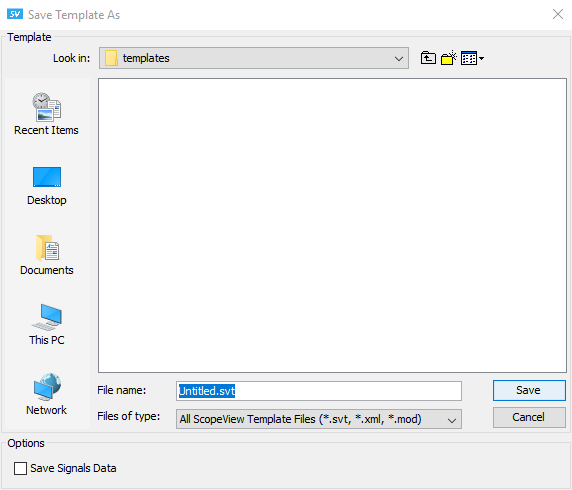
| SAVE TEMPLATE AS... | Saves a study set-up in a file for future use as a template or to help in setting up a new study in the directory of your choice. |
| DELETE TEMPLATE | Erase a template from your work station |
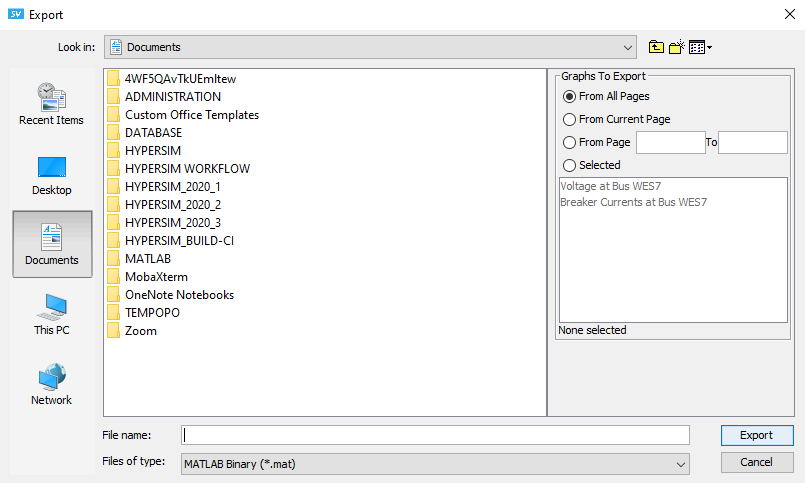
| EXPORT... | Used to transfer a result file in a different format to be used with simulation software or in a convenient format for visualization or printing purposes. Available formats are:
|
| PRINT... | Print the actual window (results) displayed on screen. Select one of the printers installed. |
| PRINT PREVIEW... | Displays the actual graphical page area (results) before printing. |
| EXIT | Quits and closes ScopeView. |
Edit Menu
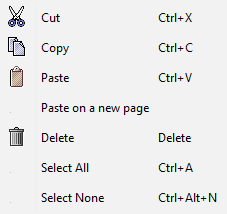
| CUT | Select a graph from the main window and click this function to remove the graph from the graphic page area and put it on the clipboard. |
| COPY | Select the graph you want and click this function to copy the graph on the clipboard. The selected graph remains on the graphic page area. |
| PASTE | This function displays the content of the clipboard on the actual graphic page area. |
| PASTE ON A NEW PAGE | A variant from the Paste option. This function creates a new page and displays the content of the clipboard. |
| DELETE | Removes the selected graph from graphic page area displayed. |
| SELECT ALL | Select all graphs displayed on the graphic page area. Another way to select all graphs: CTRL + A |
| SELECT NONE | Deselect all the graphs previously selected. |
View Menu
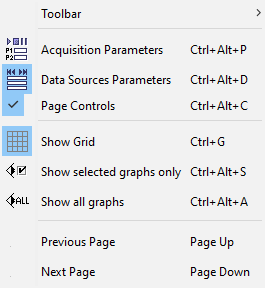
| TOOLBAR | Shows or hides menus from the Toolbar. |
| CANVAS FOOTER | Allows showing or hiding the Edit Graph buttons at the lower left-hand side of the ScopeView window. |
| ACQUISITION PARAMETERS... | Allows selecting the starting time, sampling time length (duration) and, number of acquisitions to execute. Synchronization (when ticked) specifies if a synchronization signal should be used during data acquisition2. |
| SHOW GRID | Displays grid on all graphs on the graphic page area. |
| SHOW SELECTED GRAPHS ONLY | Select the graph(s) you want to display and click this option. If you select, for example, only one graph, the later occupies the complete area of the graphic page area. Unselected graphs are hidden, not deleted. |
| SHOW ALL GRAPHS | Displays all the graphs including the ones previously hidden. |
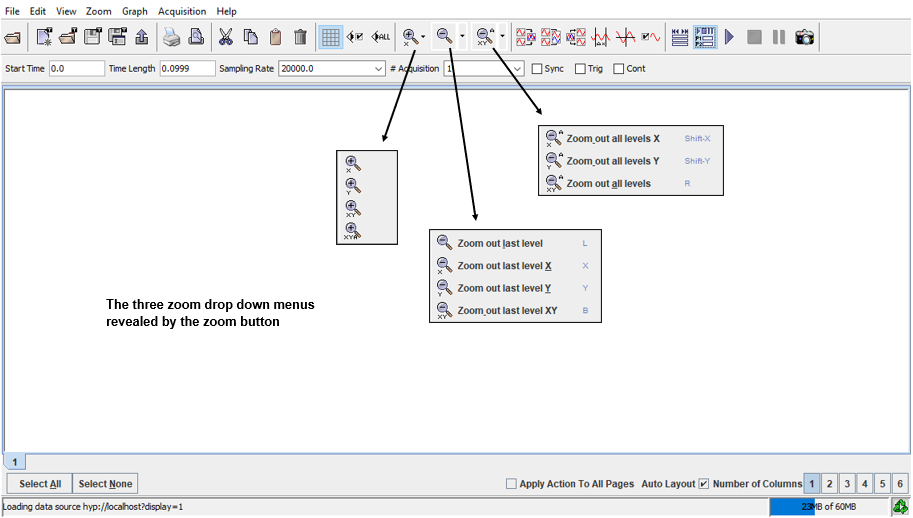
Zoom Menu
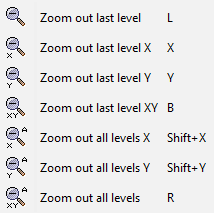
The zoom options from the menu or the control buttons at the top of the main window allow viewing parts of graphs with a greater resolution in order to focus on selected parts of graphs.
The following types of zoom are available:
| L | Zoom out last level |
| X | Zoom out last level X |
| Y | Zoom out last level Y |
| B | Zoom out last level XY |
| Shift + X | Zoom out all levels X |
| Shift + Y | Zoom out all levels Y |
| R | Zoom out all levels |
| Moreover, ScopeView remembers the zooms made to revert to a previous state or an original state. | |
Graph Menu
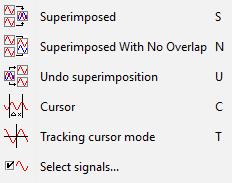
| SUPERIMPOSED | ScopeView displays two or more traces in the same graph (depending on how many signals you have selected). |
| UNDO SUPERIMPOSED | ScopeView displays one signal per graph. |
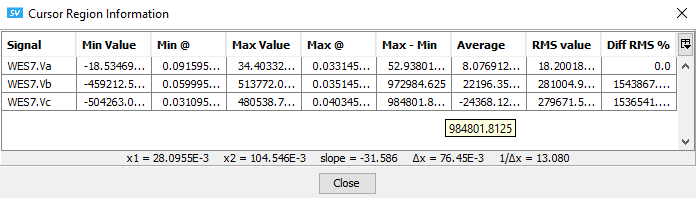
| CURSOR | ScopeView displays a Region cursor and a corresponding table. This type of cursor selects an area of interest of a graph and displays the coordinates and other information as per the table below. To activate this feature, select the Cursor item; click your mouse at the beginning of the area you want, then at the other end of the same area. |
Tracking Cursor Mode
- Change the default cursor to a cross-hair cursor. The tracking cursor follows the graph curve and displays axis values at the lower left-hand side of the graph.
- To activate the cross-hair cursor function, first select the graph(s) of interest.
- To select many graphs, press and hold the <CTRL> key then click on the graphs you want to select.
- To select all the graphs, click on the Select All button at the lower-left corner of the graphic page area.
OPAL-RT TECHNOLOGIES, Inc. | 1751, rue Richardson, bureau 1060 | Montréal, Québec Canada H3K 1G6 | opal-rt.com | +1 514-935-2323