Documentation Home Page ◇ HYPERSIM Home Page
Pour la documentation en FRANÇAIS, utilisez l'outil de traduction de votre navigateur Chrome, Edge ou Safari. Voir un exemple.
ScopeView | Graphic Page Menus
- Sylvain Ménard
Graphic Page Menus
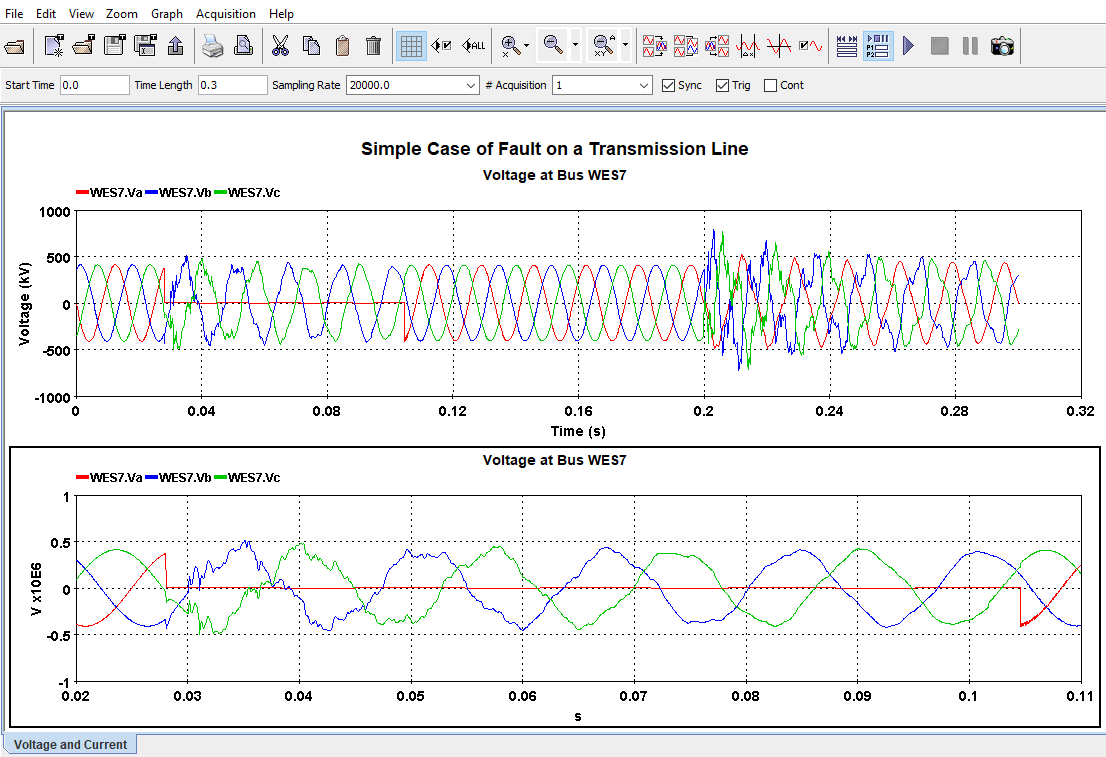
- Once the data acquisition is executed, the software displays the results graphically. It is possible to process and analyze the acquired signals. This section covers the part after the acquisition, which is usually referred to as post-processing.
- This section explains the different methods used to access post-processing functions. Since many of these functions require the selection of one or many graphs, the method used to select graphs is also described.
- Most of the post-processing functions offered by ScopeView can be selected from the toolbar or the background menu of the graphic page area.
- Most graphic actions can be executed on one or many graphs simultaneously. The software uses a general procedure to select graphs of interest.
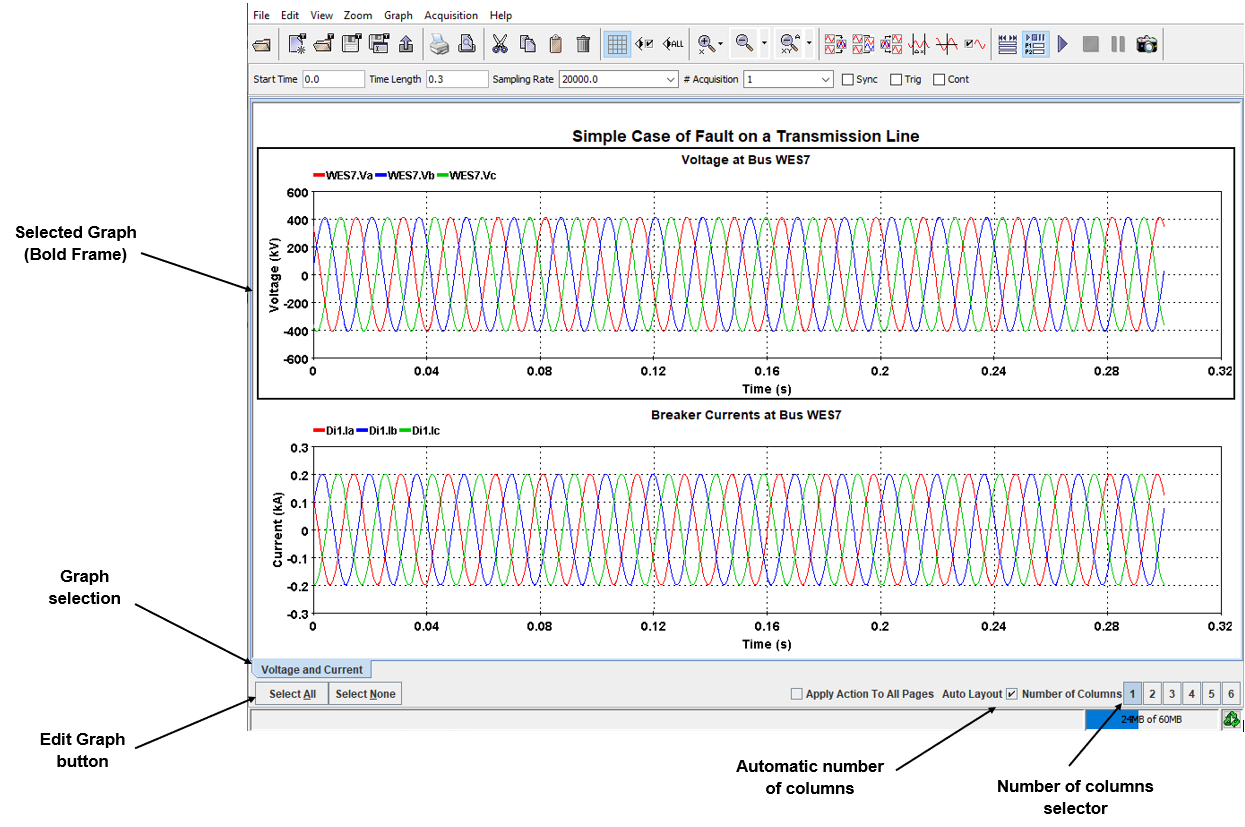
| TO SELECT GRAPHS OF INTEREST | Hold down the <CTRL> key and click each graph of interest. A frame is displayed around the graph. Deselect a graph by holding down the <CTRL> key and clicking the graph again. |
| TO SELECT ALL THE GRAPHS SIMULTANEOUSLY | Use the Edit Graph buttons at the left bottom corner of the window. |
| TO DESELECT THE GRAPHS | Use the Edit Graph buttons at the left bottom corner of the window. Or from Edit menu, choose Select None (<Ctrl+Alt+N>) item. |
Editing
This section details the methods available to edit each graphic page created during an acquisition.
- Selecting the Graphic page to display;
- Graph layout;
- Changing the appearance of graphs;
- Editing form;
- Adding specific notes;
- Saving the editing information. (ScopeView saves the editing information in the template files).
| SELECTING THE GRAPHIC PAGE TO DISPLAY | The Page selection tab at the bottom of the Graphic page navigates between the different graphic pages created during an acquisition. To change the page displayed, click the desired page tab at the bottom in the main window. |
| GRAPH LAYOUT | Changing the Number of Columns. You can change the number of columns of the current page using the Number of columns item at the bottom of the graphic page. Click the number of columns you want in the Number of Columns buttons at the bottom of the main window. |
| AUTO LAYOUT | The Auto Layout button tells ScopeView if it should or not arrange graphs automatically when changing the number of columns in a graphic page. In automatic mode, ScopeView attempts to place an identical number of graphs in each column. |
| MOVING GRAPHS MANUALLY | To allow for the maximum of freedom in editing graphs, ScopeView offers the possibility of moving a graph interactively to another location in the same column, in a different column or even to another graphic page. |
| MOVING MANY GRAPHS TO ANOTHER PAGE: | Select the graphs to be moved;
|
| TO MOVE A GRAPH TO ANOTHER LOCATION ON THE SAME PAGE: |
|
Background Menu
To display the background menu of the Graphic page, position the cursor on the graphic page;
Click the right mouse button.
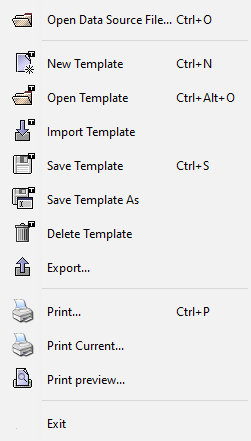
The left (or top) series of icons have been described in Section Edit Menu and are standard MS Windows icons and functions.
Grid
Grid items show or hide the grid in the selected graph.
- To add a grid to the graph, select the graph(s); from the background menu, select Grid then Show from the sub-menu.
- To hide a grid from a graph, select the graph(s); from the background menu, select Grid then Hide from the sub-menu
X and Y Type Axis
X and Y type axis item allows the user to select either Linear or Logarithmic type of graph.
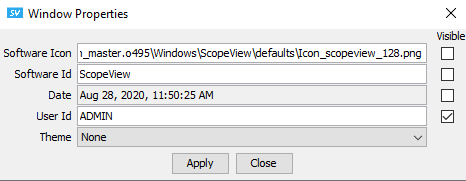
Window Properties
Window Properties opens an info form that displays the software identification; the software icon used on the graphic area page and the computer user ID.
Page Properties
Page Properties opens the following form:
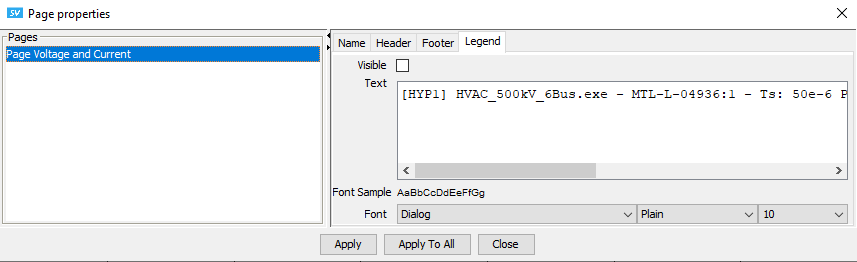
ScopeView allows you to customize editing of each page used for acquisition. You can change or add information relating to each page and also control the display of such information.
- Header tab. Used to display a header title on the top of the page.
- Footer tab. Used to display a footer title at the bottom of the page.
Graph Properties
- Graph Properties change many aspects of the selected graph. Unselected graphs can be modified from the list displayed at the left of the form.
- Type tab displays the ordinary line traced on the graph page;
- X and Y axis tabs change the selected graph title, text and unit factor;
- The label can be either scientific or engineer;
- The scale minimum/maximum can be set to the user needs; same for the tick mark spacing and precision and;
- The grid can be changed from linear to logarithmic.
- Chart color tab allows the user to change the color of:
- (i) Chart
- (ii) Chart Area
- (iii) Plot Area
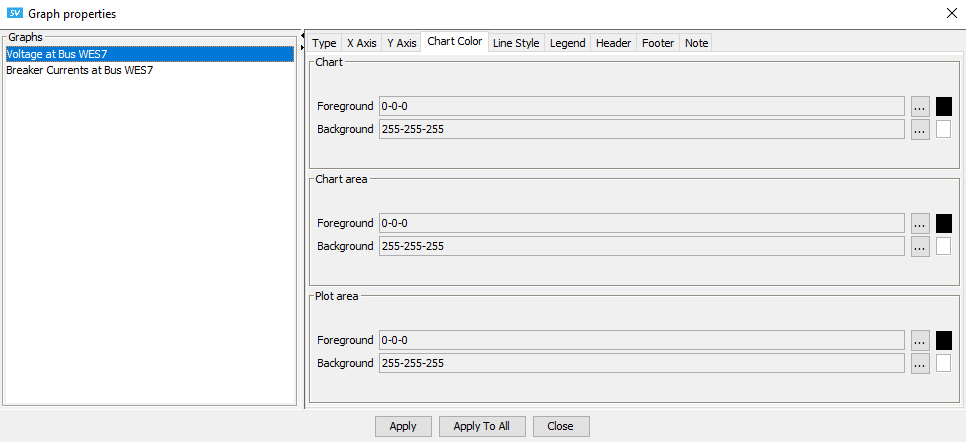
Chart
- Foreground: Graph title.
- Background: Banner above graph.
Chart area
- Foreground: X and Y axis units’ characters.
- Background: Graph background (behind the plot area).
Plot area
- Foreground: X and Y axis lines.
- Background: Graph drawing area inside X and Y axis.
Line style tab displays this mode of the graph properties form.
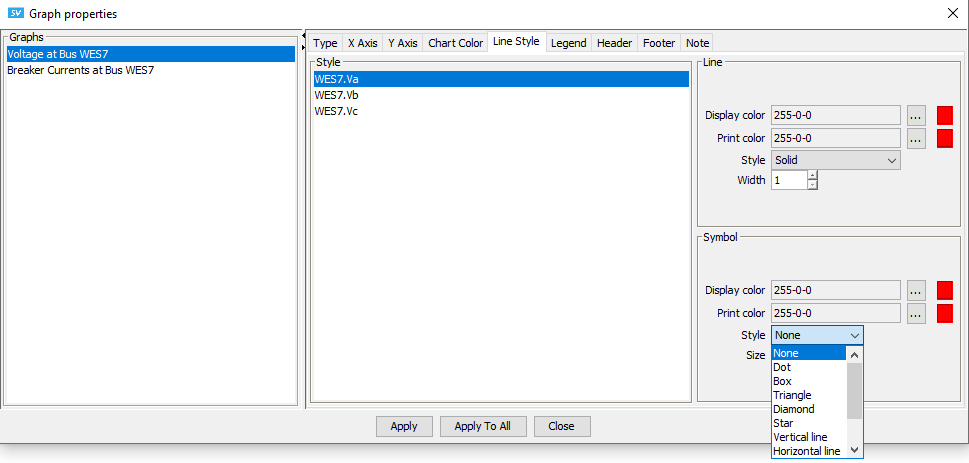
The plotted line color can be changed per user needs;
- You can also use symbols on the plotted line with user-defined size and color
- Legend tab displays or hides the title shown at the top of the chart
- Header and Footer tabs add text or comments in the Header/Footer
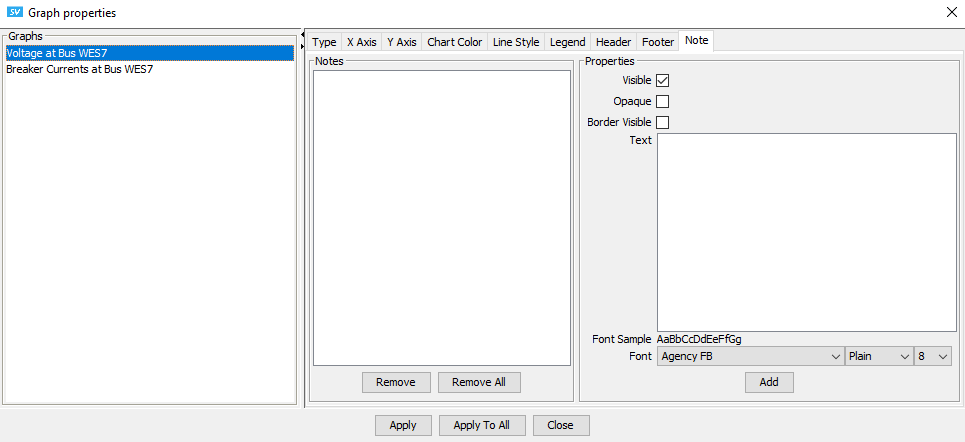
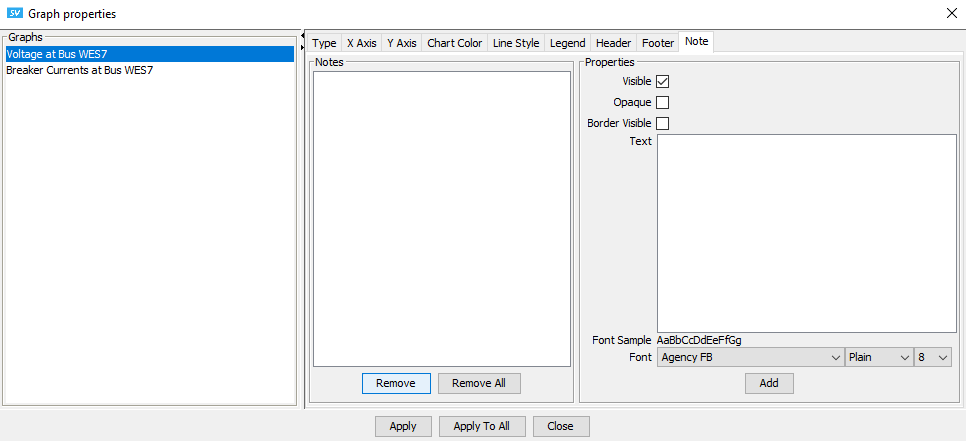
- A note can be added to the plotted area of the selected chart from this mode of the Graph properties form.
- To add a note to a graph, select the Note tab from the Graph Properties window, enter the desired note in the text field then click the Add button to move the text in the Notes field.
- Select the note you want to see in the graph from the Notes field and click Apply.\
You can drag and drop the note anywhere on the graph.
To erase a note, select the Remove or the Remove all button to erase the note. Click Apply.
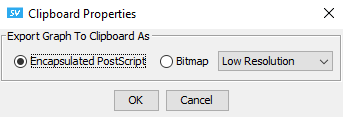
Clipboard Properties
Select the format you want to store information on the clipboard (from the Copy command/ icon) to be printed, pasted or exported. To copy and paste in Word, use Bitmap, to export use Encapsulated PostScript.
Toolbar Menu
To accelerate handling, the most common graphic page functions can also be accessed directly through the buttons at the top of the graphic page. For example, one of the buttons allows you to zoom in quickly on the selected graphs.
The Zoom options from the tool bar menu or from the accelerator buttons allow viewing parts of graphs with a greater resolution in order to focus on selected parts of the graphs.
Moreover, ScopeView stores the zooms made to revert to a previous state or an original state.
Zoom In Options
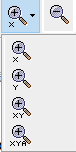
- To execute an X zoom, click on the graph(s) of interest;
- Then click the button at the top of the graphic page.
- Position the mouse cursor at the left of the region of interest. Hold down the left button then drag the mouse to the right to sweep the region of interest and finally, release the button.
- There is almost no limit to the number of horizontal zooms that can be applied to a given curve. The only limit is that at least two points should always be displayed.
- There are two ways to cancel the effect of zooms in: last or all levels.
ZOOM OUT LAST LEVEL OPTION
- The last level option of the toolbar allows reverting one-step to the previous zoom. ScopeView cancels only the effect of the last step.
- To execute a last level zoom out, click on the graph(s) of interest then click the button in the toolbar.
- The selected graph(s) reverts to the last level in X-axis automatically;
The same action can be performed in Y-axis or in XY axis together as per the icon selected respectively.
ZOOM OUT ALL LEVELS OPTIONS
- The All levels option allows you to revert to the initial display state. ScopeView then cancels the effect of all the previous zooms.
- To execute a global zoom out, click on the graph(s) of interest then click the button in the tool bar.
- The selected graph(s) reverts to the original level in X-axis automatically;
- The same action can be performed in Y-axis or in XY axis together as per the icon selected.
OPAL-RT TECHNOLOGIES, Inc. | 1751, rue Richardson, bureau 1060 | Montréal, Québec Canada H3K 1G6 | opal-rt.com | +1 514-935-2323
Follow OPAL-RT: LinkedIn | Facebook | YouTube | X/Twitter