Documentation Home Page ◇ HYPERSIM Home Page
Pour la documentation en FRANÇAIS, utilisez l'outil de traduction de votre navigateur Chrome, Edge ou Safari. Voir un exemple.
Examples | GHOST Microgrid Model with Protection Scheme
- Sylvain Ménard
- Jean-Nicolas Brunet
Location
This example model can be found in the software under Protection > GHOST_ugrid_Protection.ecf".
Description
The GHOST model is based on the Banshee distribution network model developed by NREL and Massachusetts Institute of Technology Lincoln Laboratory during the Microgrid & DER Controller Symposium held in February 2017 [1] [2]. The GHOST microgrid is a distribution level power system model with three feeders having various Distributed Energy Resources (DER) like Diesel Generators (DG), Solar Photovoltaic generation system (PV), Battery Energy Storage Systems (BESS), Combined Heat and Power (CHP). The model also includes the protection sub-systems with relays and control logics for safe operation and control of the network.
For GHOST Microgrid model without protection scheme, please refer to Examples | GHOST Microgrid Model
The main objective of this demo example is to showcase the implementation of the protection relays and associated control logics on the network. A simple microgrid power management control is also featured which demonstrates the working of various DERs under the grid-connected and respective islanded modes of operation. The featured microgrid controller can be completely or partially replaced by user-designed controllers for HIL studies. The model time step is: 100us
Network Description
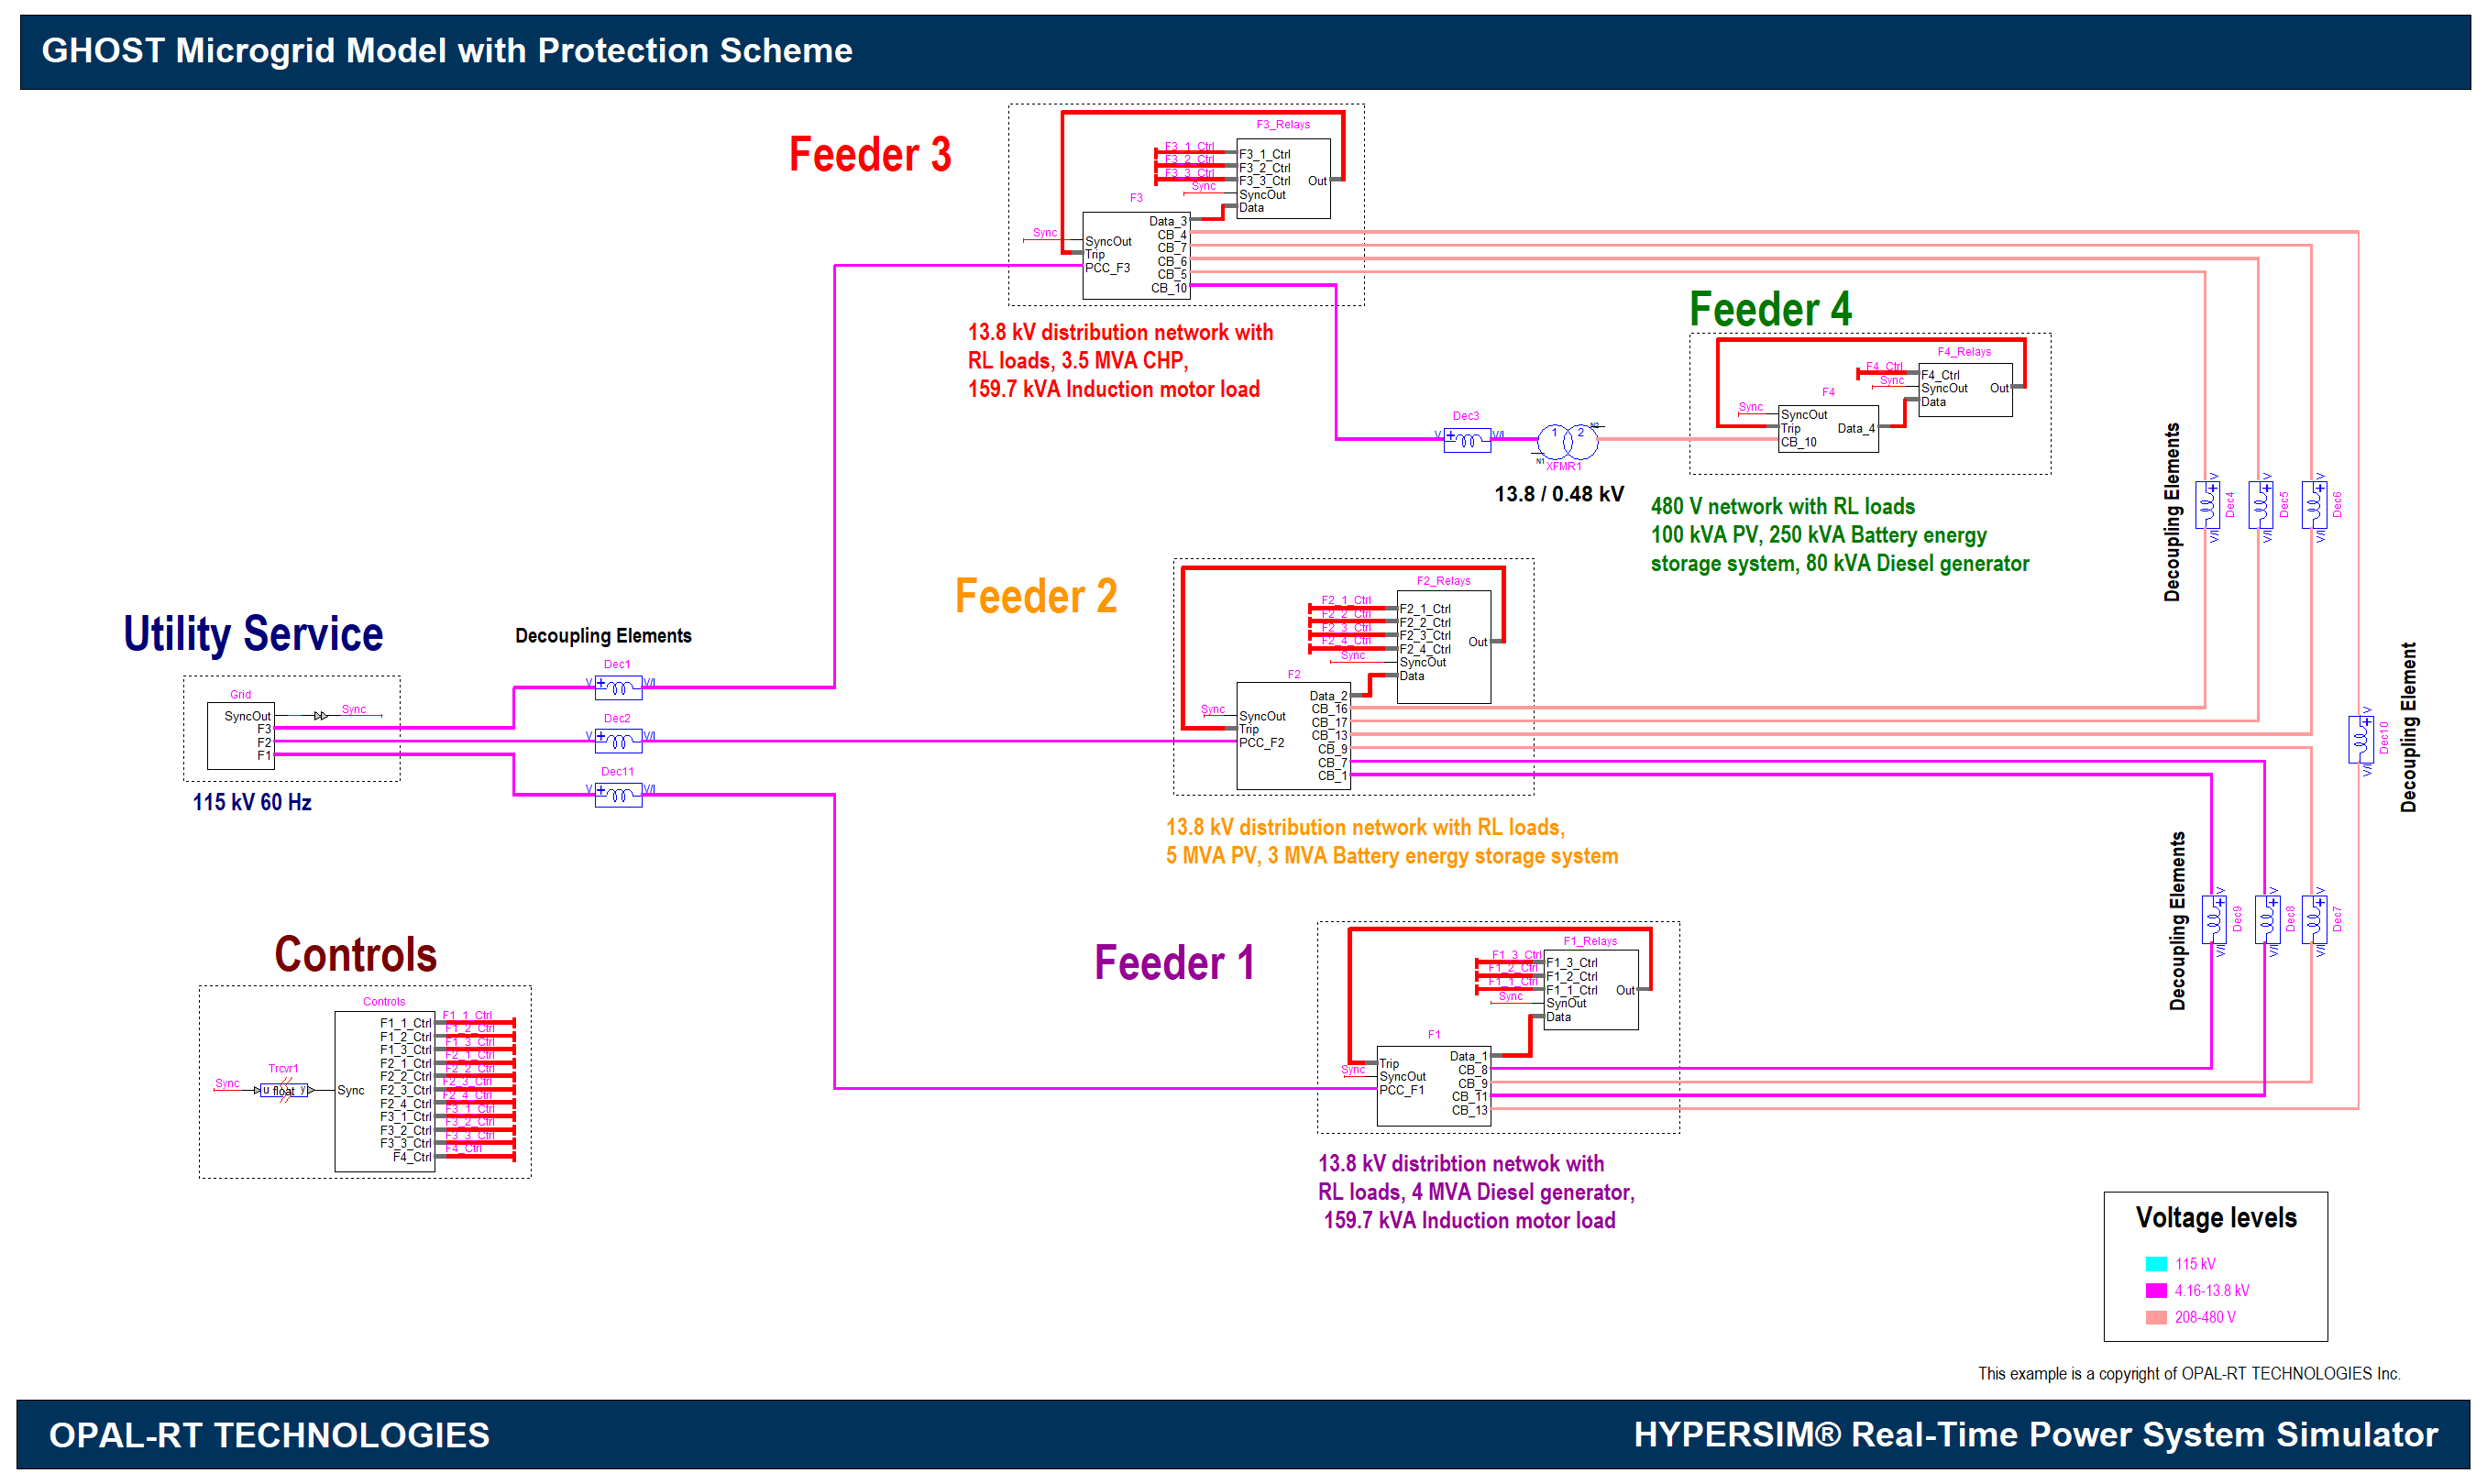
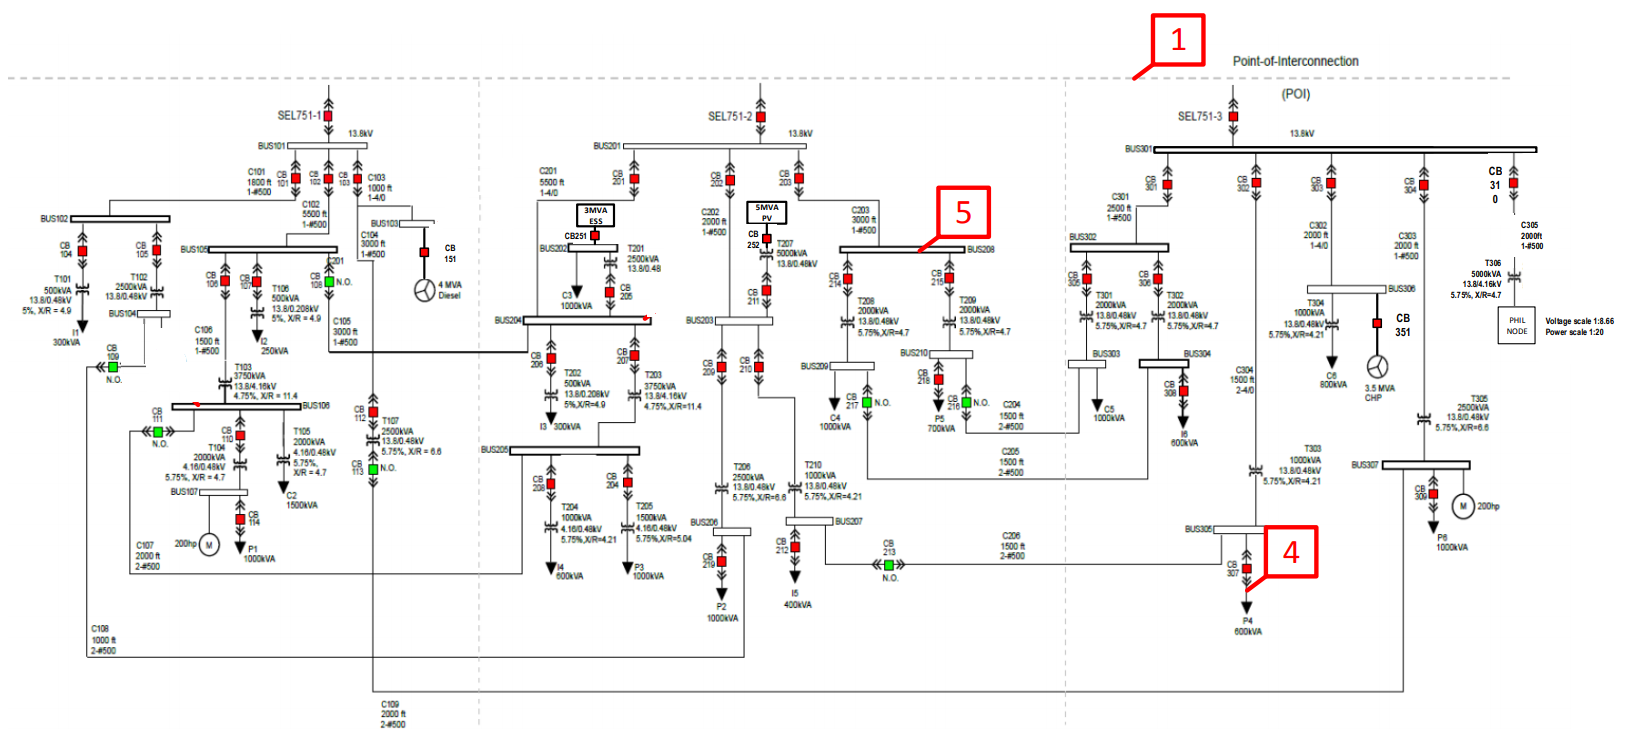
The figure below shows the single line diagram of the GHOST network [1]:
The model consists of three main feeders (Feeder 1-3) supplying electric power to distributed loads. The utility grid of the model is rated at 115 kV and is connected to the rest of the network operating at multiple medium and low voltage levels, specifically at 13.8 kV, 4.16 kV, 480 V, and 208 V. The model consists of eighteen loads (modeled as RL branches) which are categorized as 6 critical, 6 priority, and 6 interruptible. Critical loads have high requirements for continuous electrical service, power quality, and reliability. Priority loads can be disconnected during contingencies or islanding to maintain power balance. Interruptible loads can be shed during the time of contingencies. In addition to these loads, there are two large induction motors of 159.7 kVA rating at Feeder 1 and Feeder 3, representing industrial setup.
The table below shows the ratings and responsibility of each DER used in the model.
DER type | Location | Power rating (kVA) | Voltage rating (kV) | Grid-forming capability |
|---|---|---|---|---|
Diesel generator | Feeder 1 | 4000 | 13.8 | Yes |
PV | Feeder 2 | 5000 | 0.48 | No |
BESS | Feeder 2 | 3000 | 0.48 | Yes |
CHP | Feeder 3 | 3500 | 13.8 | Yes |
Diesel generator | Feeder 4 | 80 | 0.48 | Yes |
PV | Feeder 4 | 100 | 0.48 | No |
BESS | Feeder 4 | 250 | 0.48 | Yes |
All the DERs are also implemented along with their associated controllers like exciters, governors, converter controls etc.
The model also consists of Feeder 4, which is the representative model of an actual laboratory PHIL setup of DERs connected to the network [1]. It is to be noted that the PHIL node interface is not modeled here, and the feeder is connected to the rest of the network through a 13.8/0.48kV transformer at the end of Feeder 3. Feeder 4 consists of two busses, a 100 kVA PV system, a 250 kVA battery energy storage system, and an 80 kVA diesel generator [1].
Protection Relay Implementation
Relays perform the control logic required by the circuit breakers to open or close their contacts. Relays are also used to gather system measurements and status. For each circuit breaker, a multi-function protection relay subsystem is equipped. Each relay has its own thresholds and time delay settings. The following relay protection functions are implemented in the model:
- Synchronizing or synchronism check (ANSI Standard Device Number 25)
- Phase instantaneous overcurrent (ANSI 50P)
- Phase time overcurrent (ANSI 51P)
- Under-voltage (ANSI 27)
- Overvoltage (ANSI 59)
- Under-frequency (ANSI 81U)
- Over-frequency (ANSI 81O)
- Rate-of-change-of-frequency (ANSI 81R)
Further, the relay includes multiple relay setting groups for protection during different configurations. Two predefined parameter groups are enabled to establish its active protection settings. Each protection function can be configured by adjusting, for example, pickup or delays. This helps the users to perform various studies like understanding the fault contribution of DERs for various types of faults, relay coordination among various circuit breakers for fault at various locations.
Multi-Relay Block
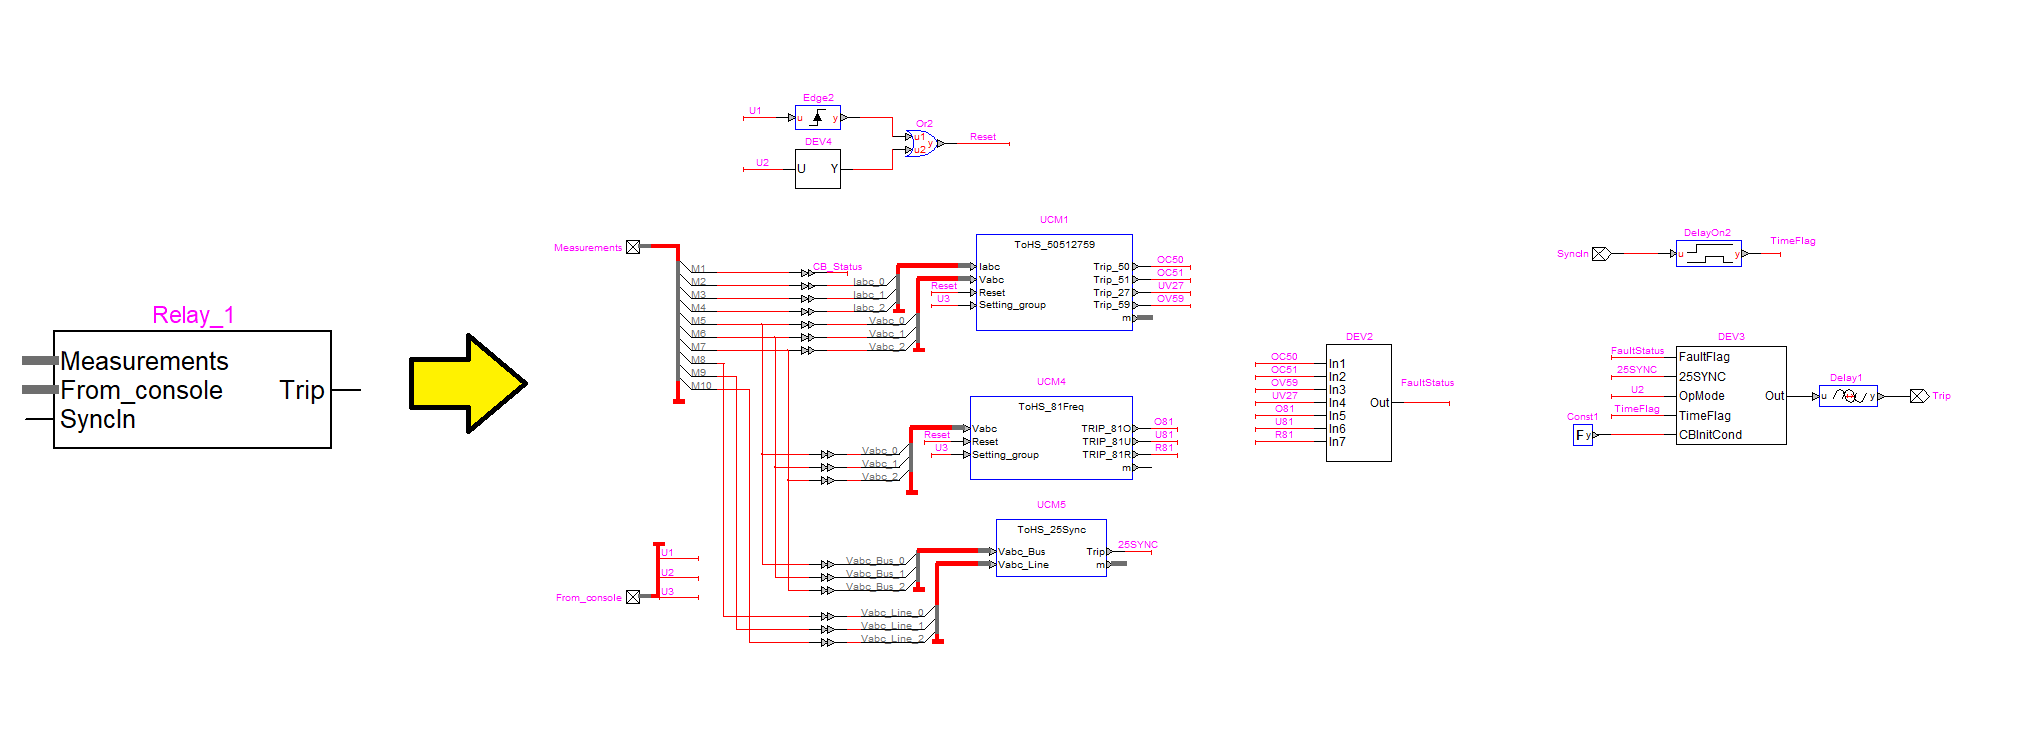
The figure below shows the multi-relay block implemented in the model:
General tab
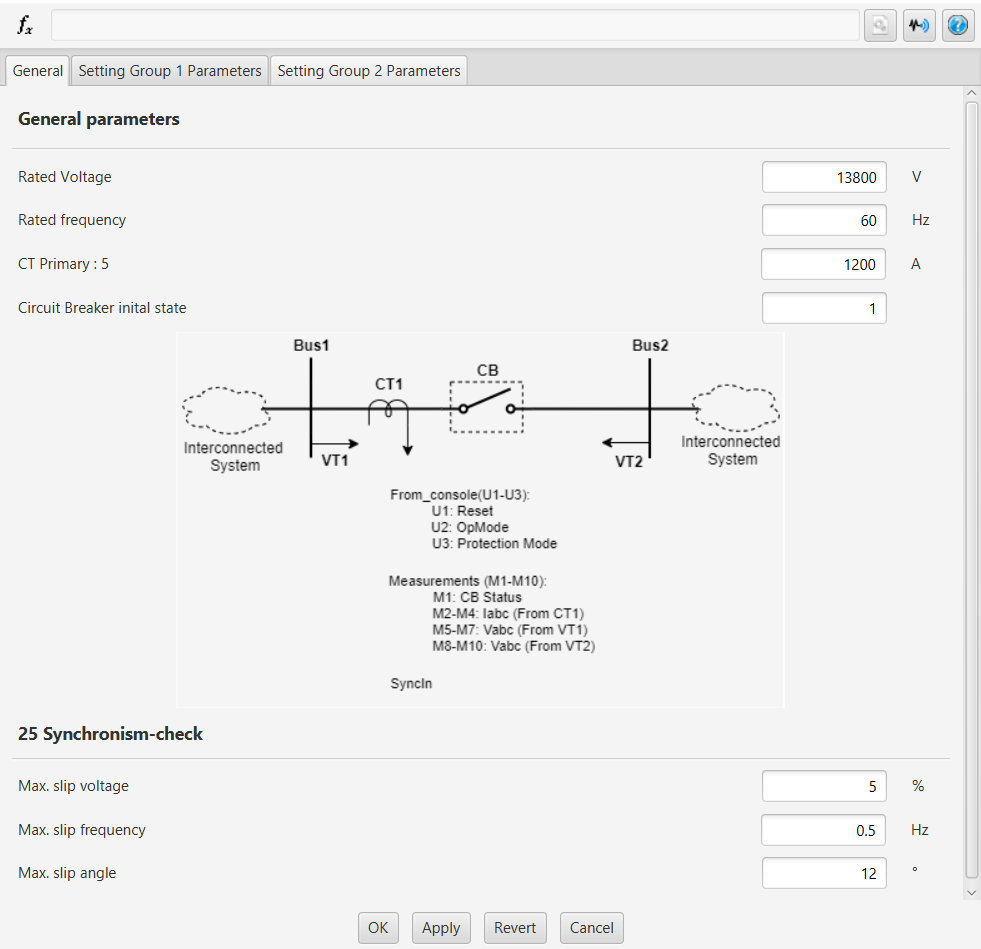
The following parameters are tunable:
Name | Description | Unit |
|---|---|---|
Rated Voltage | Line to Line rms voltage | V |
| Rated Frequency | System frequency | Hz |
CT Primary:5 | CT Primary current rating | A |
Circuit Breaker initial state | Initial state of a Circuit Breaker; Close=1, Open =0 | na |
| Max. slip voltage | Threshold for dV in 25-Synchronism check | % |
| Max. slip angle | Threshold for dPhi in 25-Synchronism check | deg |
| Max. slip frequency | Threshold for dF in 25-Synchronism check | Hz |
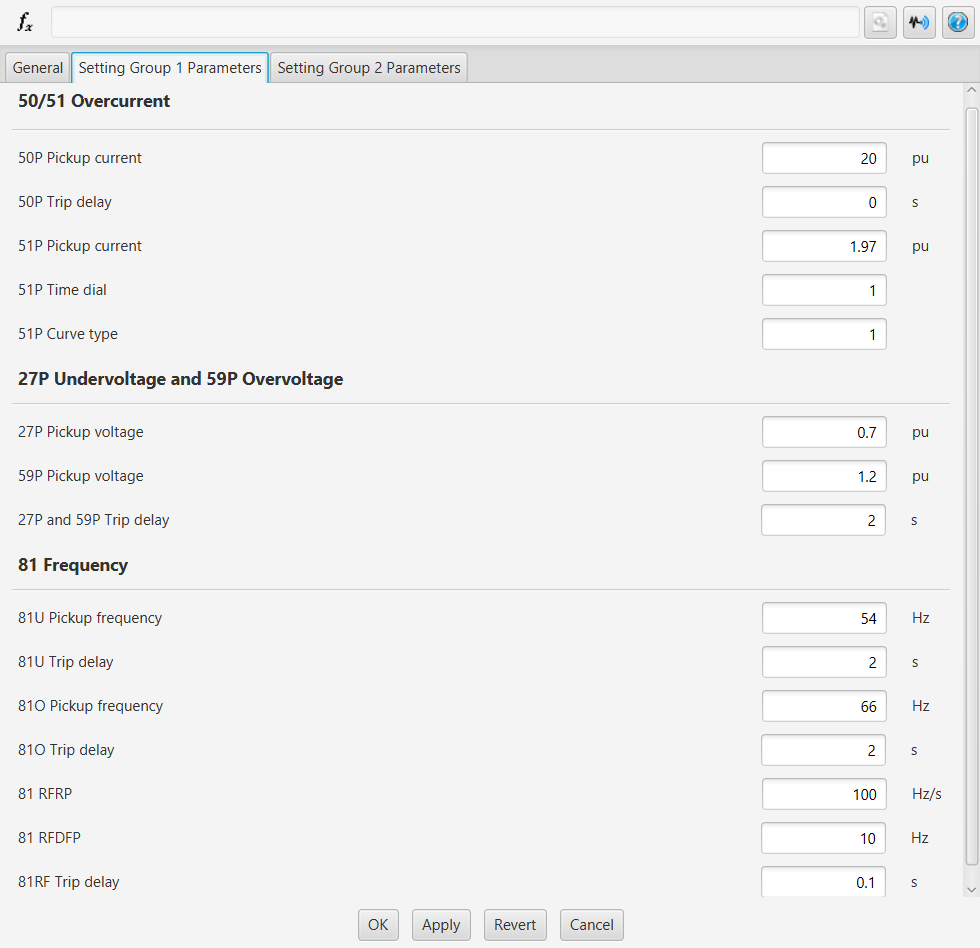
Setting Group 1 Parameters tab
Setting Group 2 Parameters tab
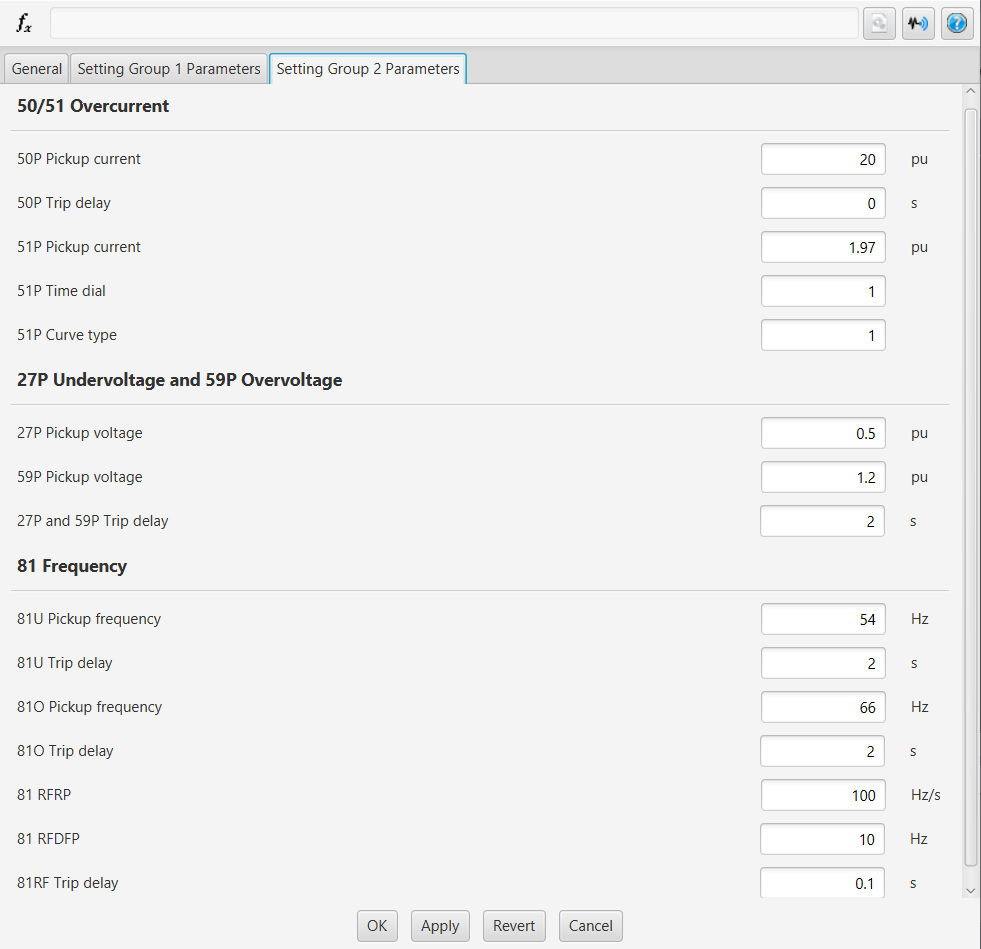
The following settings are tunable:
Name | Description | Unit |
|---|---|---|
50P Pickup current | Pickup Current 50P | pu |
50P Trip delay | Time delay for Trip 50P | s |
51P Pickup current | Pickup Current 51P | pu |
51P Curve type* | Inverse curve type selection for 51P | - |
51P Time dial | Time dial setting 51P | - |
27P Pickup voltage | Pickup voltage 27P | pu |
59P Pickup voltage | Pickup voltage 59P | pu |
27P and 59P Trip delay | Time delay for Trip 27P and 59P | s |
81O Pickup frequency | Pickup frequency for 81O | Hz |
81O Trip delay | Time delay for Trip 81O | s |
81U Pickup frequency | Pickup frequency for 81U | Hz |
| 81U Trip delay | Time delay for Trip 81U | s |
81 RFRP | Pickup of the rate of change of frequency | Hz/s |
| 81 RFDFP | Pickup RFDFP | Hz |
81R Trip delay | Time delay for Trip 81R | s |
*- Different curve types can be selected by having the below values as a setting '51P Curve type' :
'1' : US U1 (Moderately Inverse)
'2' : US U2 (Inverse)
'3' : US U3 (Very Inverse)
'4': US U4 (Extremely Inverse)
Inputs and outputs
I/O Name | Type | Description |
|---|---|---|
Measurements | Input
| A 10-dimensional(M1-M10) multiplexed input. M1: CB Status M2 - M4: current Ia, Ib, and Ic flowing through the CB. M4 - M7: voltage Va, Vb, and Vc form one side of CB (Input-side). M5 - M10: voltage Va, Vb, and Vc from the other side of CB (Output-side). |
From_console | Input
| A 3-dimensional(U1-U3) multiplexed input. U1: Reset U2: OpMode ( U2= 0 -> to force breaker to close; U2= 1 -> for logic based operation of breaker) U3: Protection Mode ( U3= 1 -> Multi relay block will assume setting group 1 paremeters; U3= 0 -> Multi relay block will assume setting group 2 paremeters.) |
SyncIn | Input | This input needs to be connected with SyncOut of the POW. |
Trip | Output | During normal operation of the system Trip =1 and during a fault or any disturbance it becomes 0. |
The 10 measurements i.e. the CB status, three-phase currents flowing through the CB, input side three-phase voltages, and output side three-phase voltages are taken at each CB in the model as shown in the below figure.
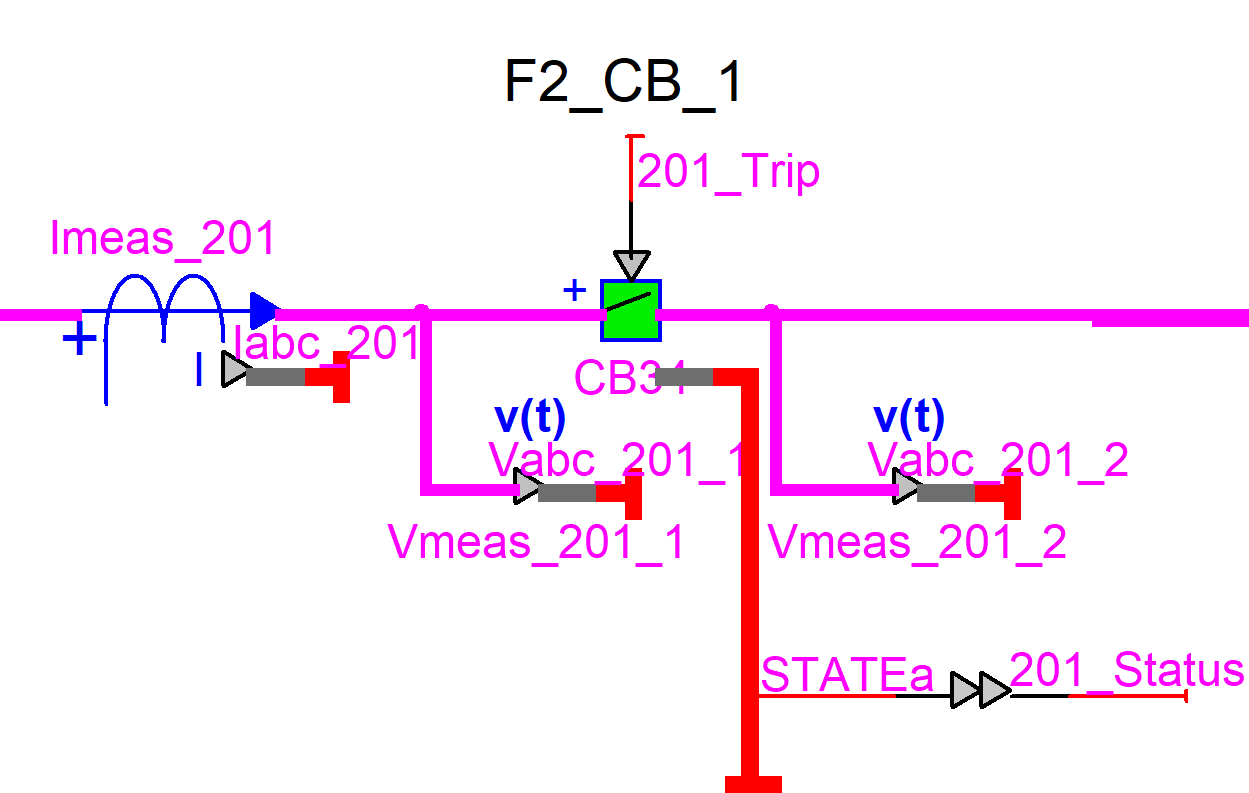
In each feeder, all these measurement signals from each CB are multiplexed and sent as a bundled input to the corresponding feeder relay subsystem. In each relay subsystem, these bundled signals are demultiplexed and are given as inputs to the respective relay blocks of the CBs. Each relay subsystem comprised of different protection functions will examine the condition of the network and issue the' Trip' output that controls the breaker status.
The figure below shows the implementation of the protection relay subsystem (shown for feeder 2 relay subsystem) in the model. The fault protection of the GHOST model will be provided by multiple relays that can be controlled by a microgrid controller.
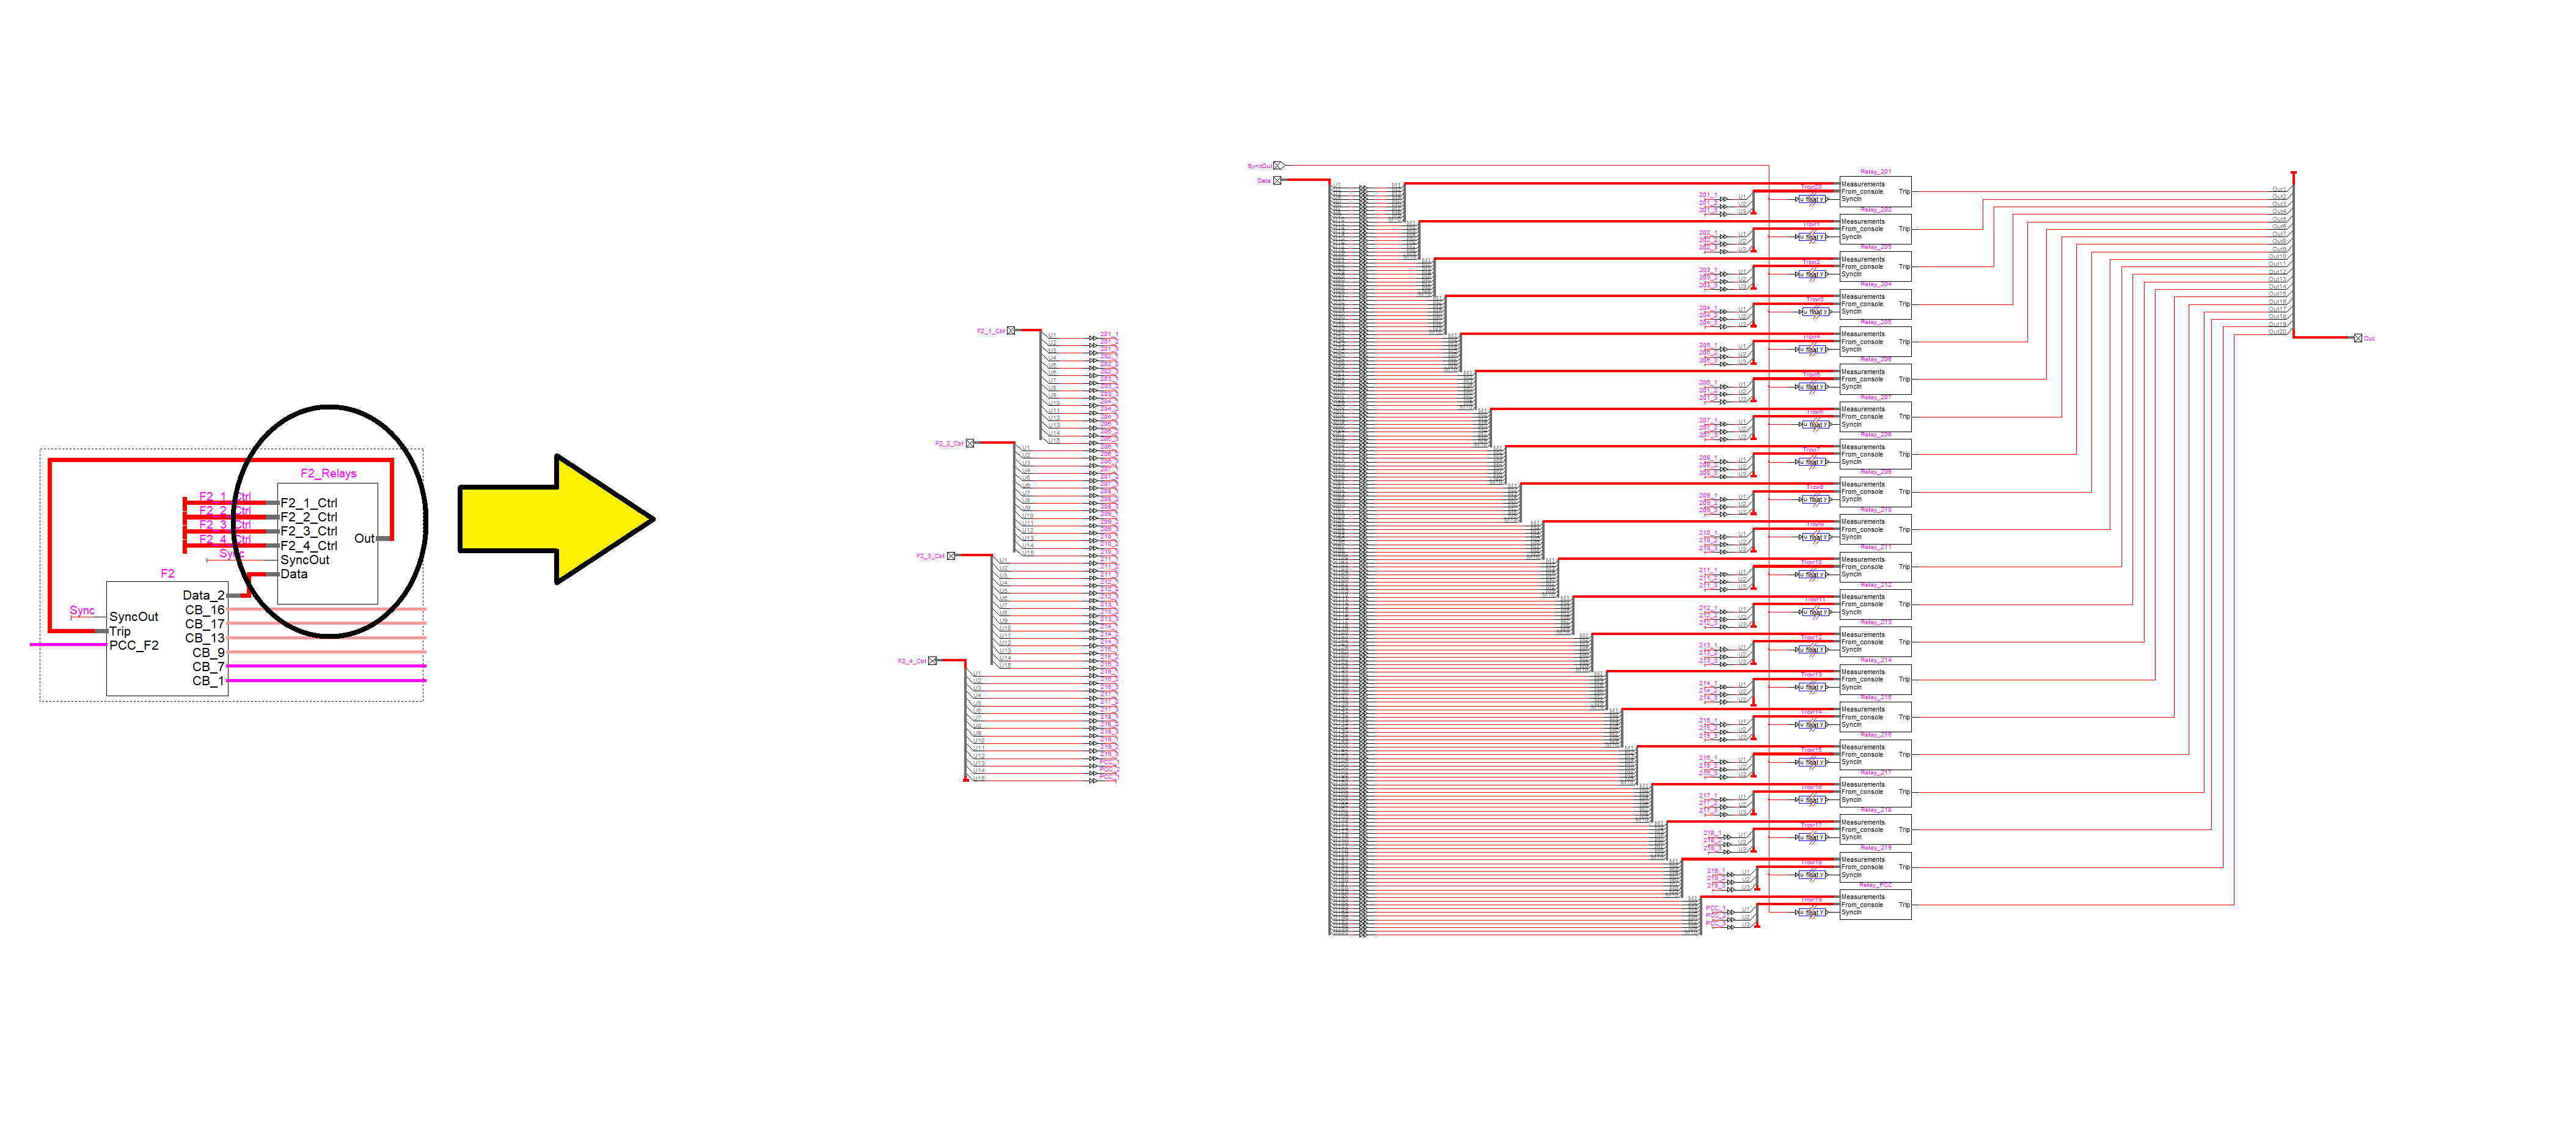
The table below shows the various relay settings used in the model.
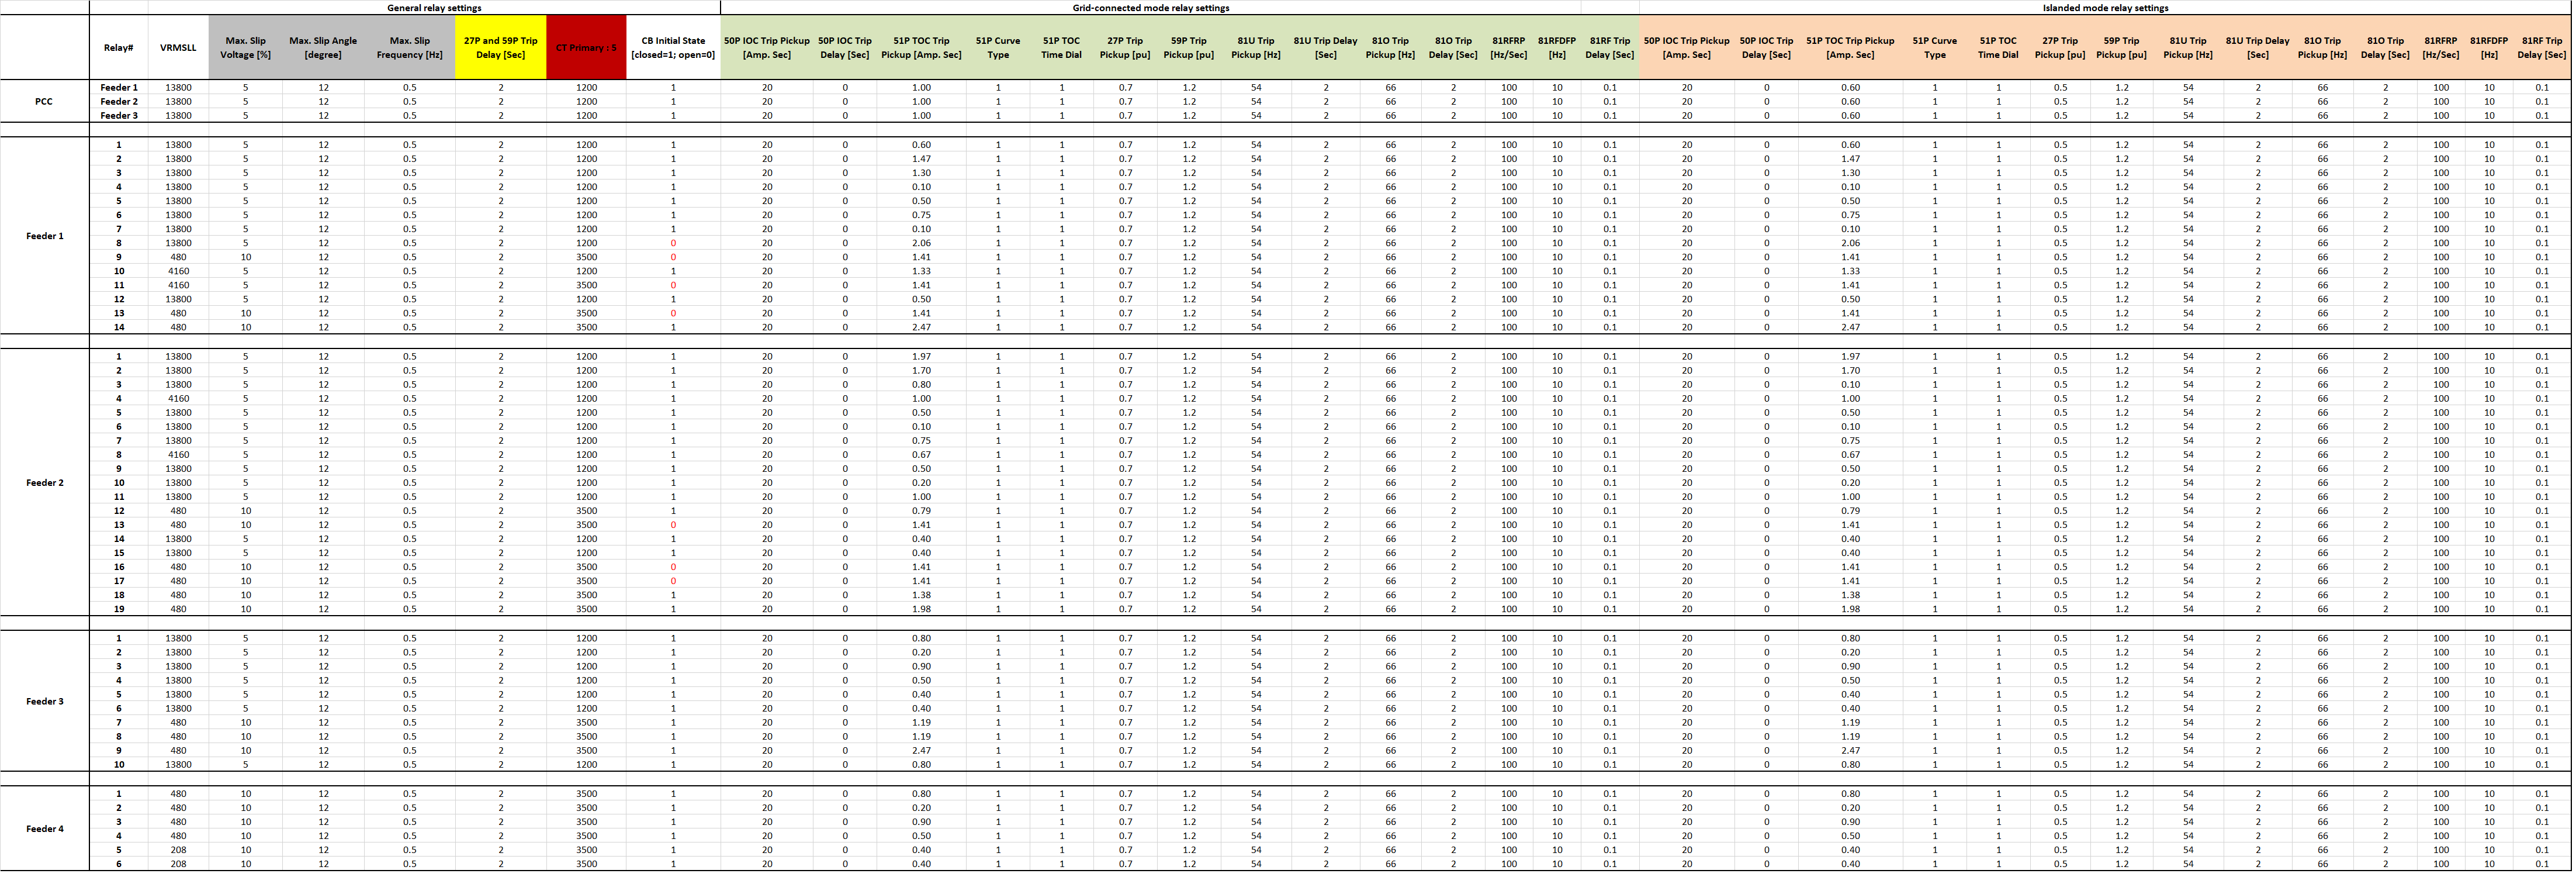
Note: All the protection functions implemented are designed for only 60 Hz operation.
Simulation and Results
The complex model as described above is operated under various scenarios as described below.
When executing in real-time, it is recommended to put "opgcc" in Settings – Target – Compiler and Linker.
Test Scenarios/Sequence of Events
The following sequence of events is applied by taking a data acquisition in the ScopeView with Sync and Trigger options checked. The simulation starts with all the DERs connected to the grid. The active and reactive power setpoints of the DERs connected at different feeders are tabulated as below:
Power References of DERs at Start of Simulation
Feeder | Type of DER | Active Power (pu) | Reactive Power (pu) |
|---|---|---|---|
Feeder 1 | DG | 0.8 | 0.5 |
Feeder 2 | BESS | 0.8 | 0.2 |
PV | 0.8 | 0.2 | |
Feeder 3 | CHP | 0.8 | 0.4 |
Feeder 4 | BESS | 0.8 | 0.1 |
DG | 0.6 | 0.1 | |
PV | 0.2* | 0 |
*- Increased to 0.8 pu in the test scenario 3.
Scenarios Considered
| Step | Test Scenario | Time | Description |
|---|---|---|---|
1 | Scenario 1 | T = 0 s | Model starts in grid-connected mode. |
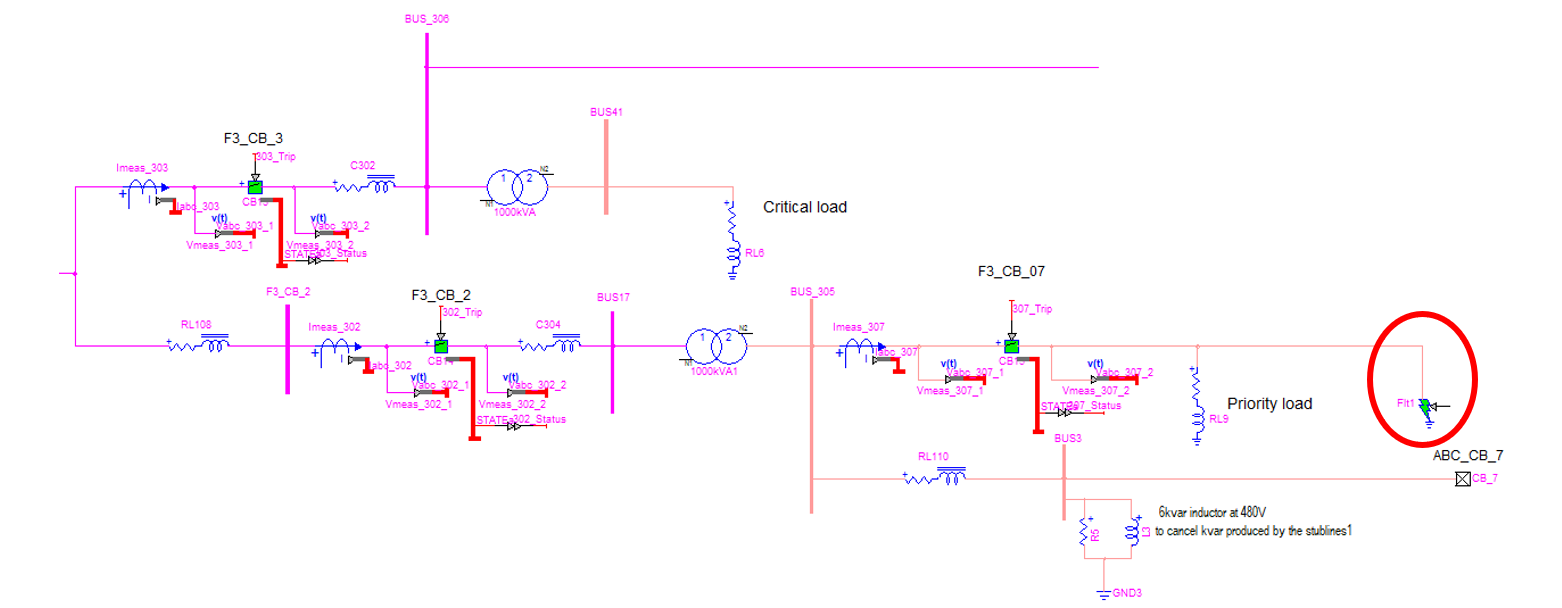
2 | Scenario 2 | T = 10 s | A three-phase to ground fault of time duration 0.5 s happens at location 4 in feeder 3 as shown in the figure below. |
| 3 | T = 10.21 s | Multi-relay block 307 in feeder 3 relay subsystem isolates the faulty section. | |
| 4 | Scenario 3 | T = 15 s | Active power of PV at feeder 4 is increased from 0.2 pu to 0.8 pu in steps of 0.15 pu / 0.5 s emulating an increase in the solar irradiance. |
| 5 | Scenario 4 | T = 17.98 s | A three-phase to ground fault of time duration 0.1 s happens at location 1 on the grid side as shown in the figure below. |
| 6 | T = 18 s | Grid side breakers get opened and three islands are created. | |
| 7 | Scenario 5 | T = 27 s | A three-phase to ground fault of time duration 5 s happens at location 5 in feeder 2 as shown in the figure below. |
| 8 | T = 27.42 s | Multi-relay block 203 in feeder 2 relay subsystem clears the faulty section. |
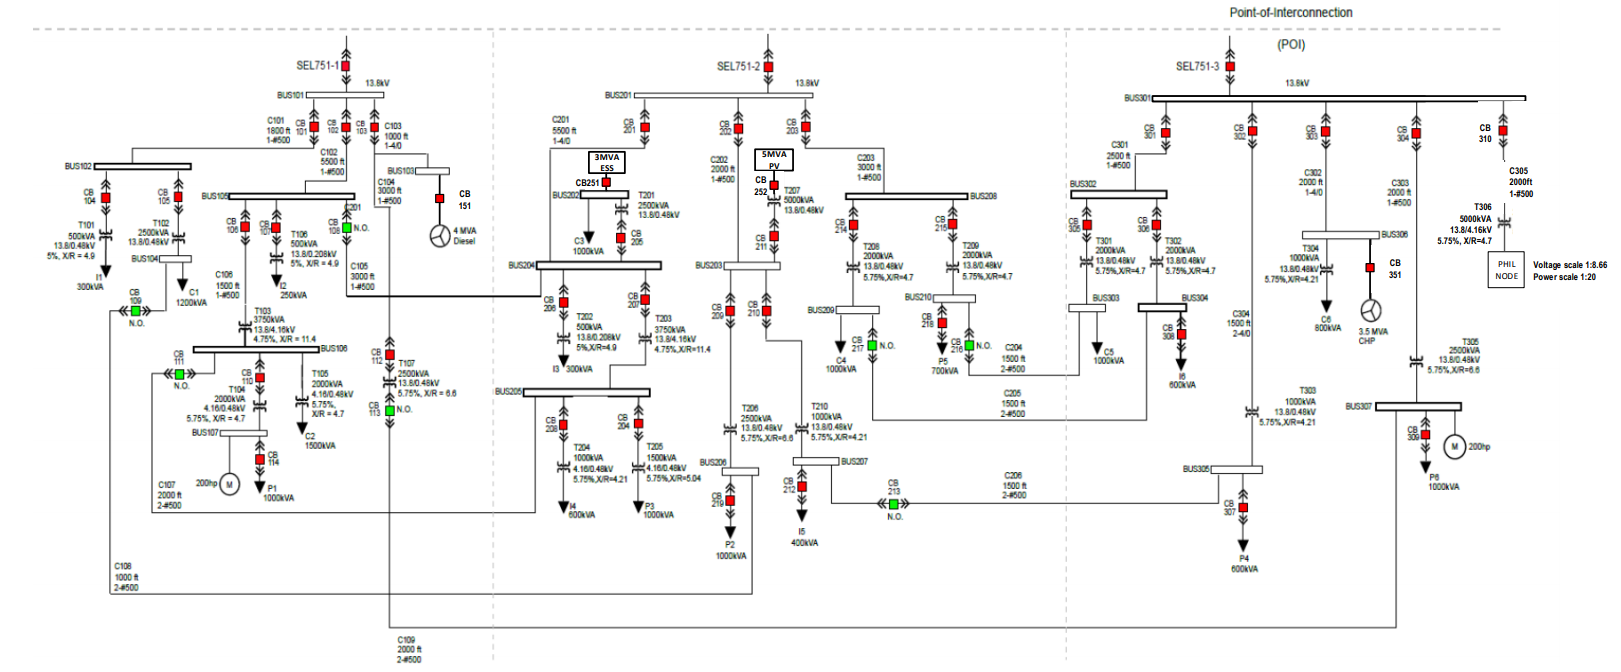
The figure below shows the different fault locations [1] that were considered in the test scenarios.
Steps to be followed:
Start the simulation and launch ScopeView, open the template: ‘GHOST_ugrid_Protection.svt’.
Make sure both ‘Sync’ and ‘Trig’ are checked, then start the data acquisition. The figures below show the results of the model under various scenarios.
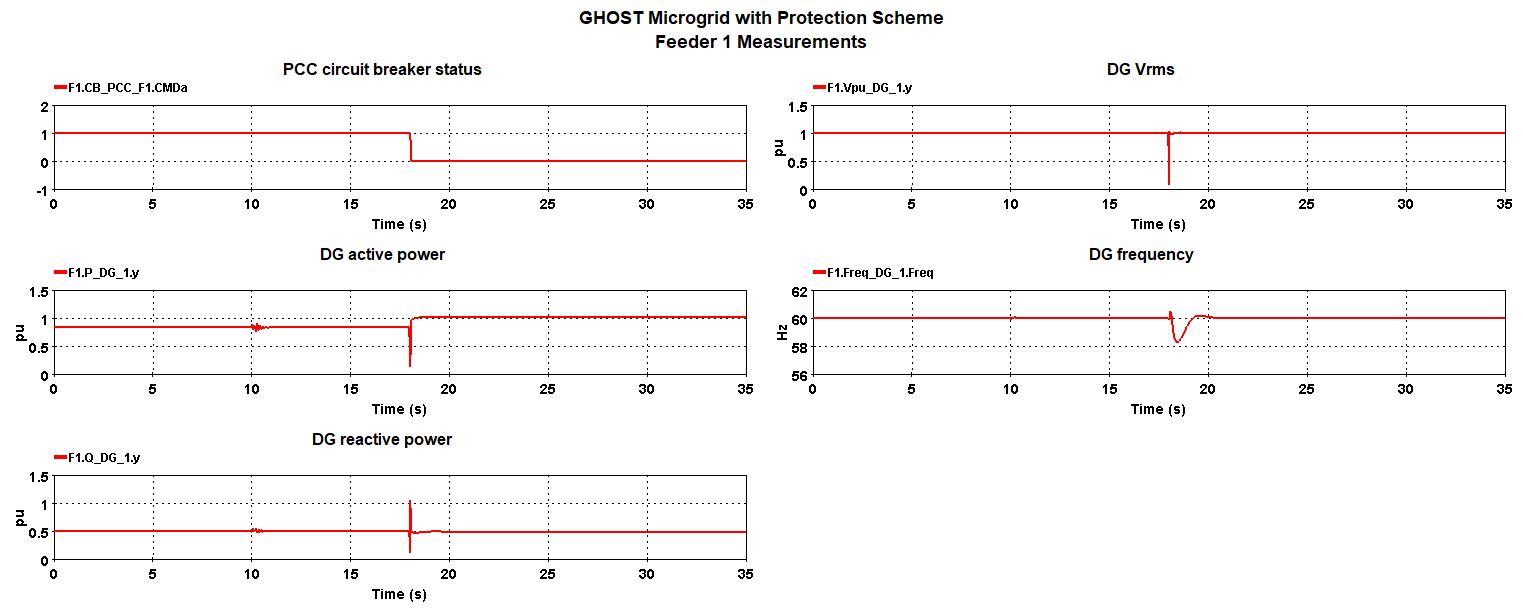
Feeder 1 measurements:
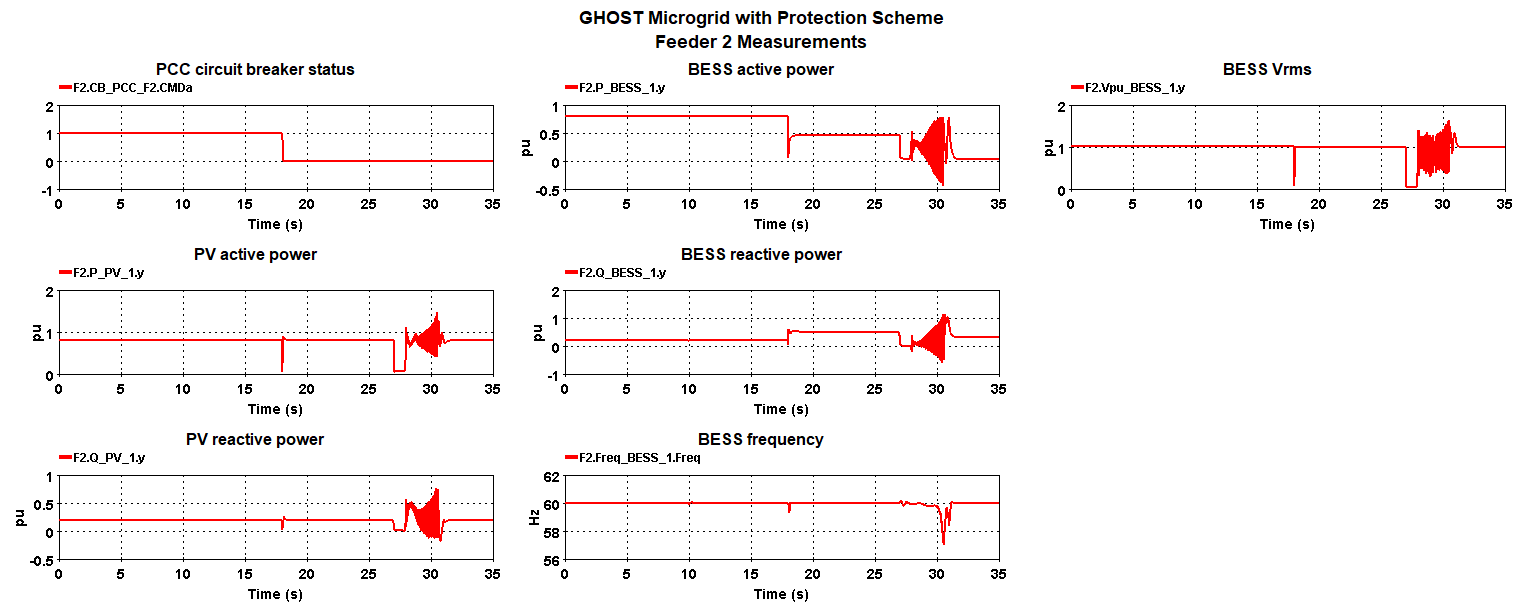
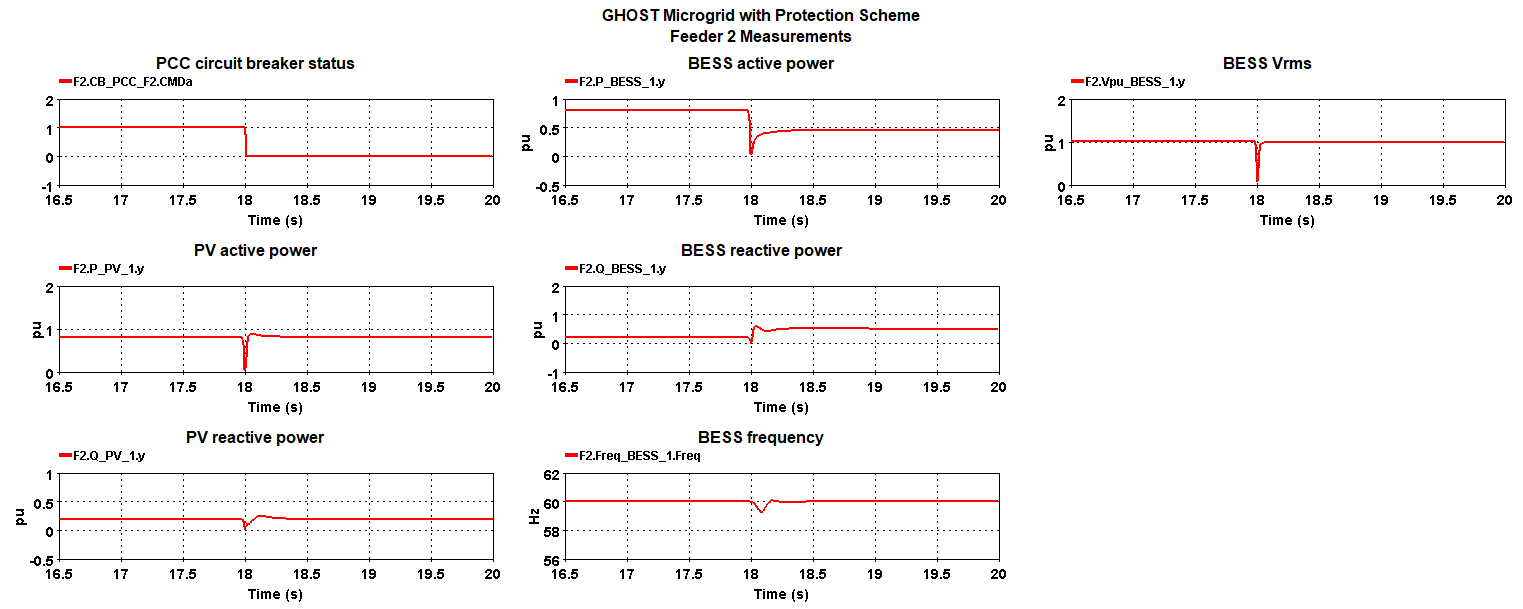
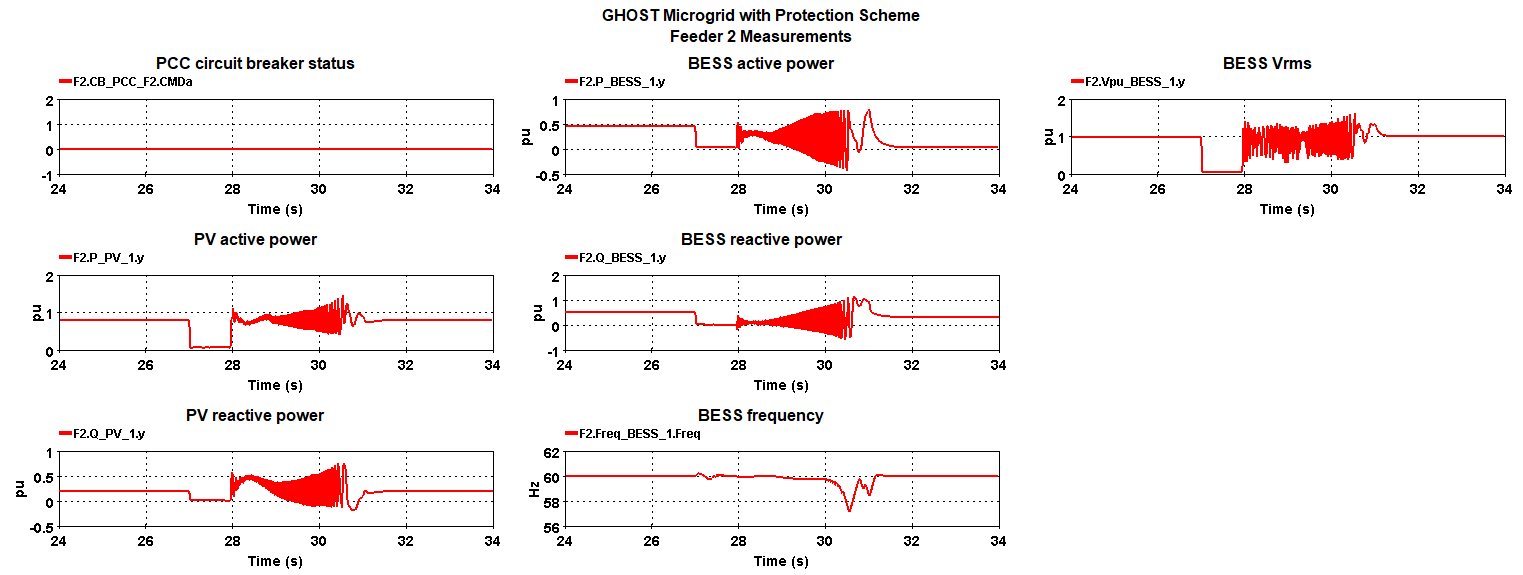
Feeder 2 measurements:
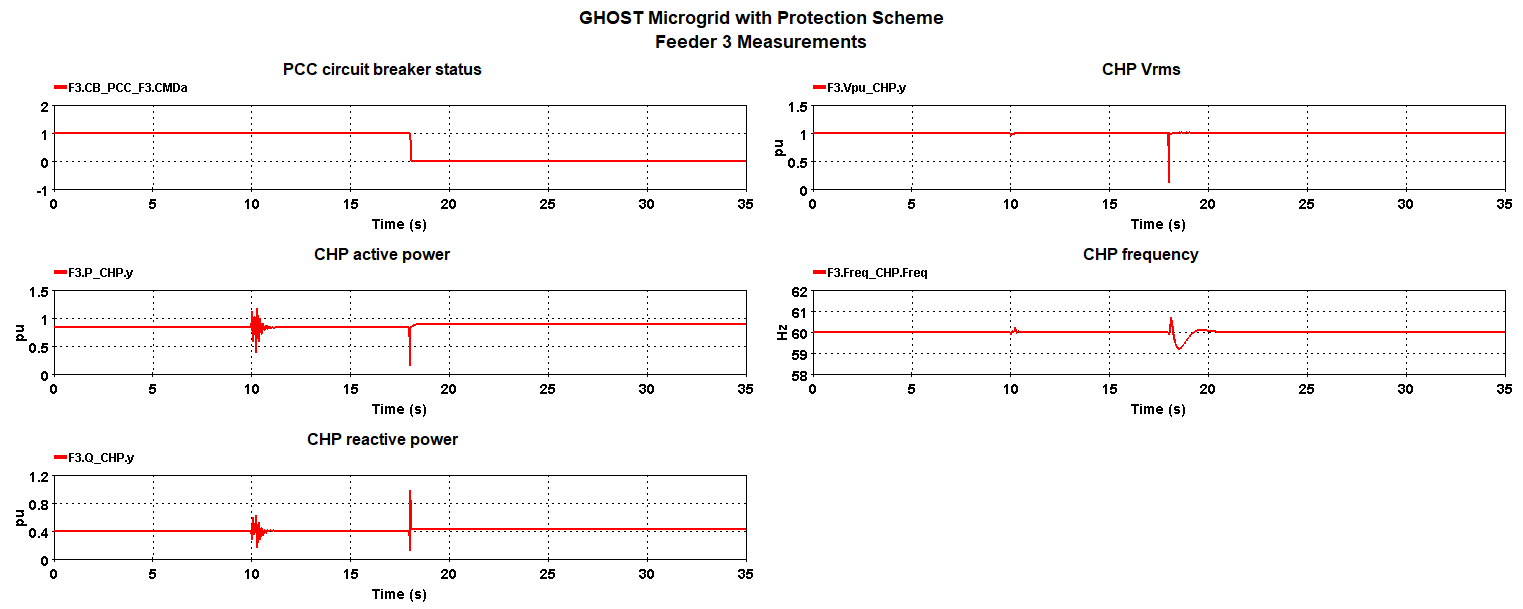
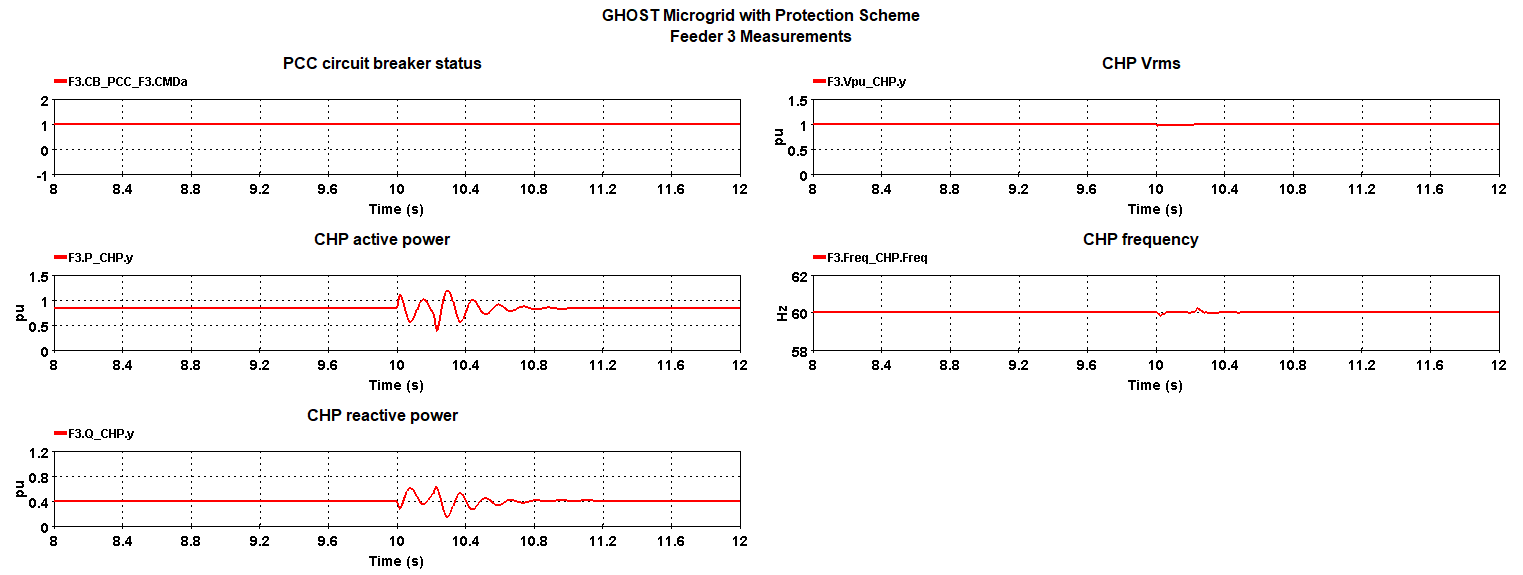
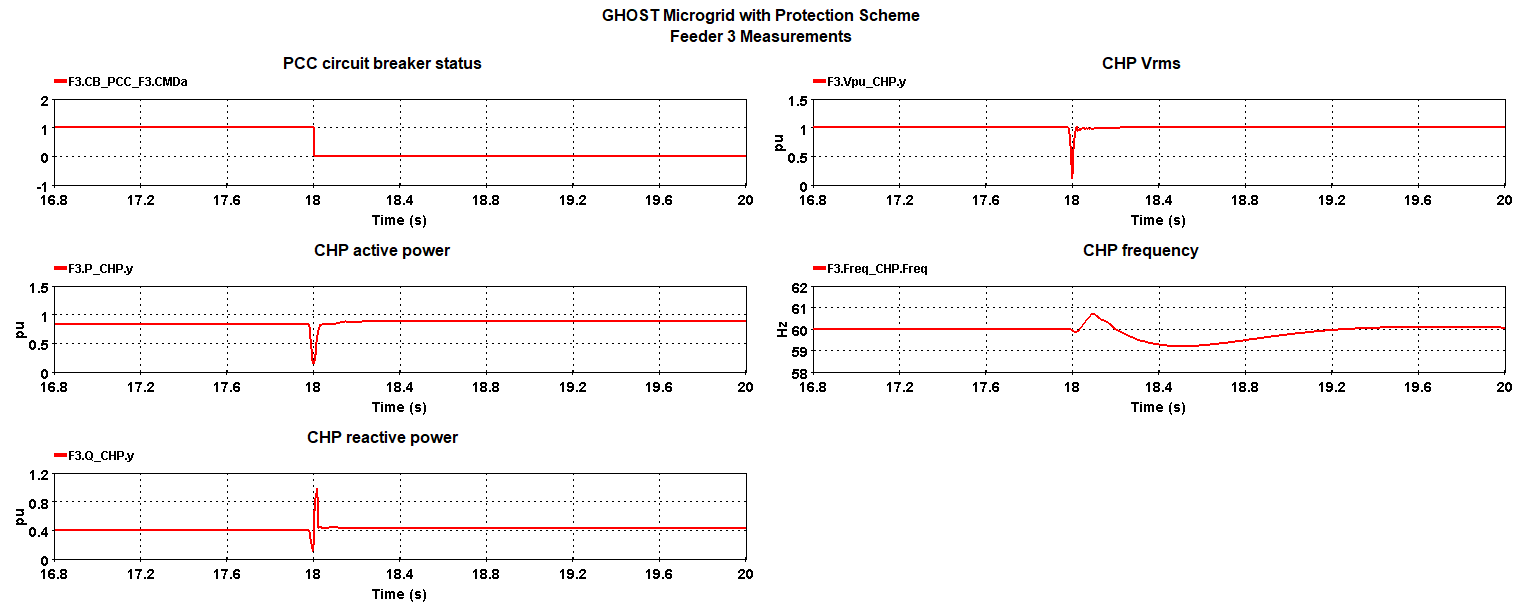
Feeder 3 measurements:
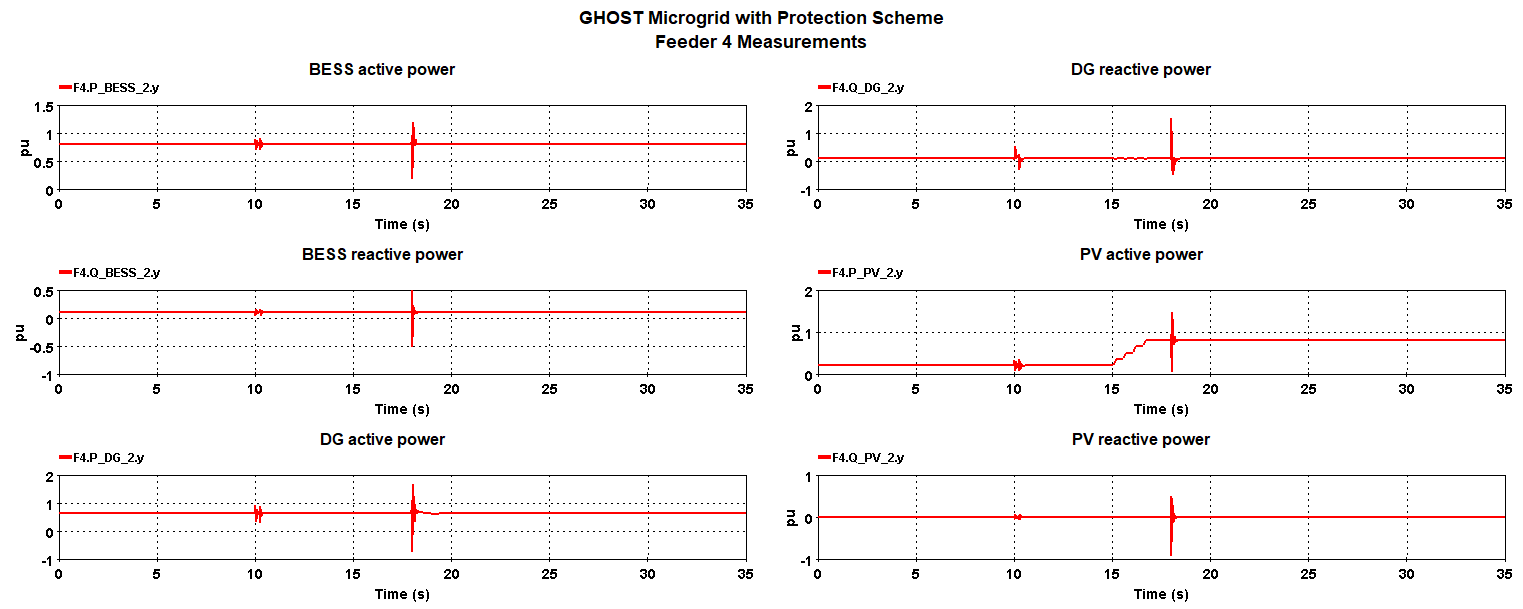
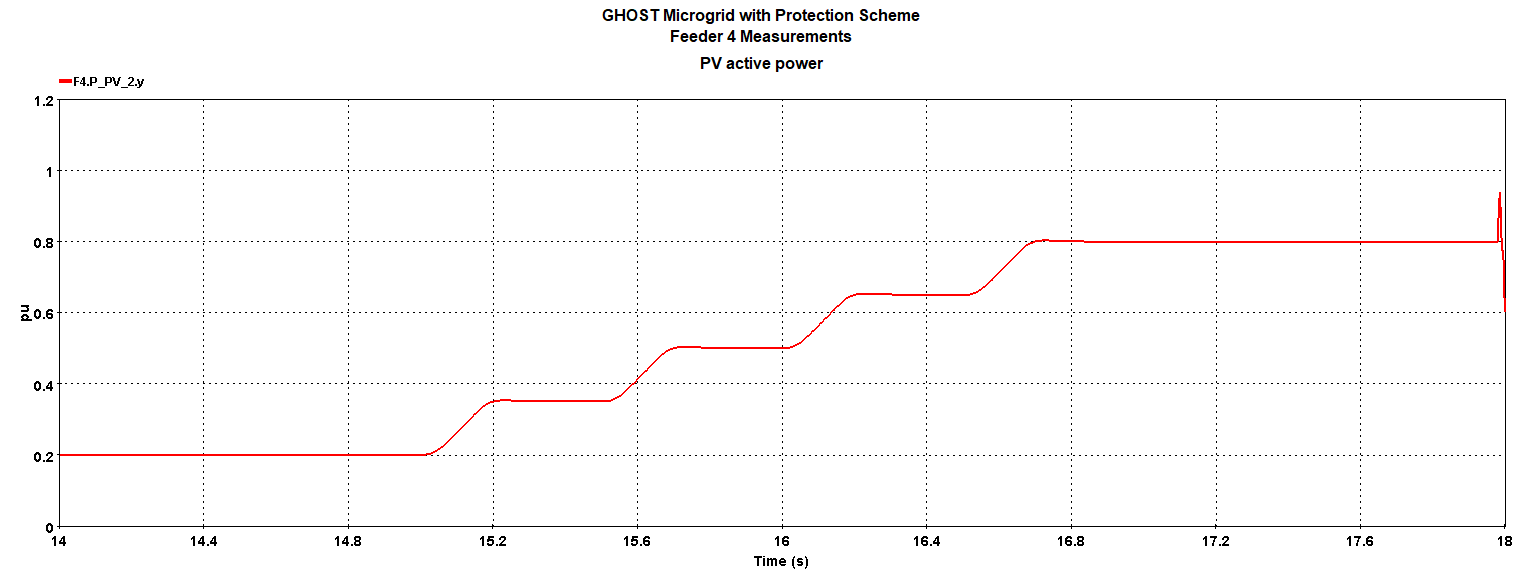
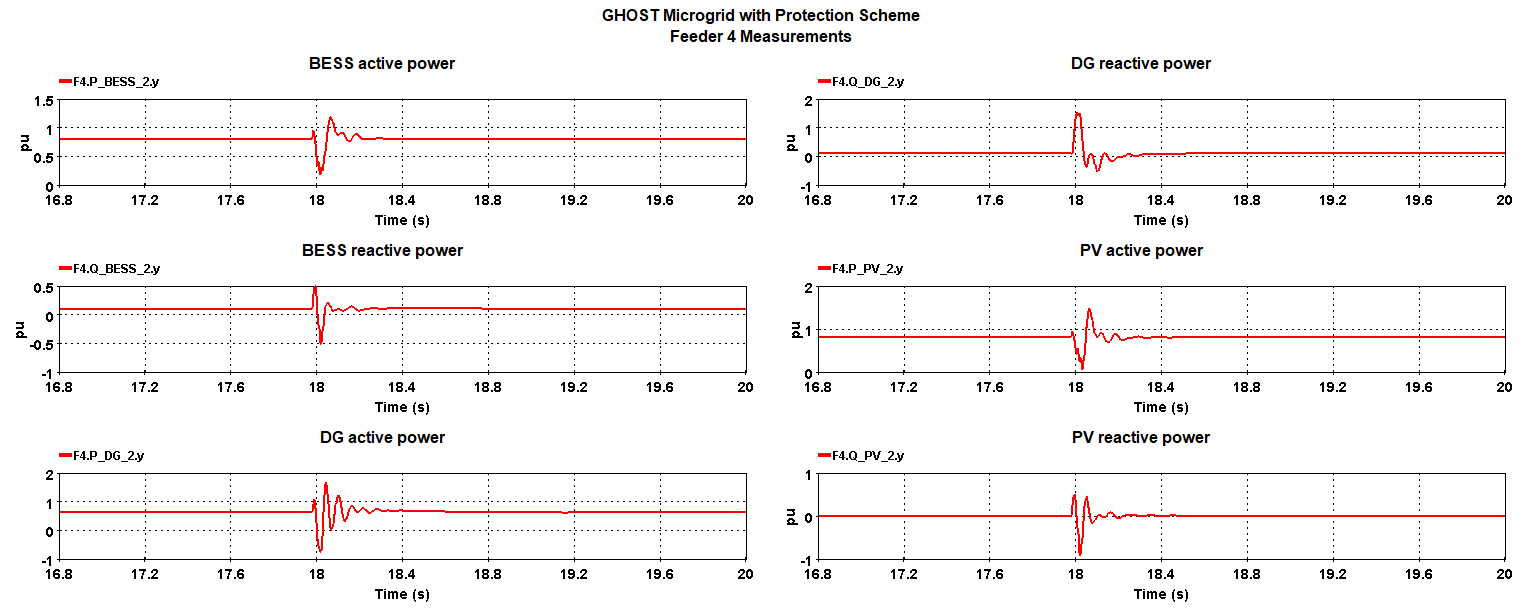
Feeder 4 measurements:
Scenario 1: From time t = 0 s to t = 10.00 s, this scenario demonstrates that the model starts with all feeders in the grid-connected mode and the DERs supplying power as mentioned in the above table. From the above figures it can be seen that all the DGs in different feeders are tracking the active and reactive power references in the grid-connected mode this shows the model is working stably.
Scenario 2: From time t = 10 s to t = 10.50 s, a three-phase-ground fault happens at the load side in Feeder 3 as shown in the figure below.
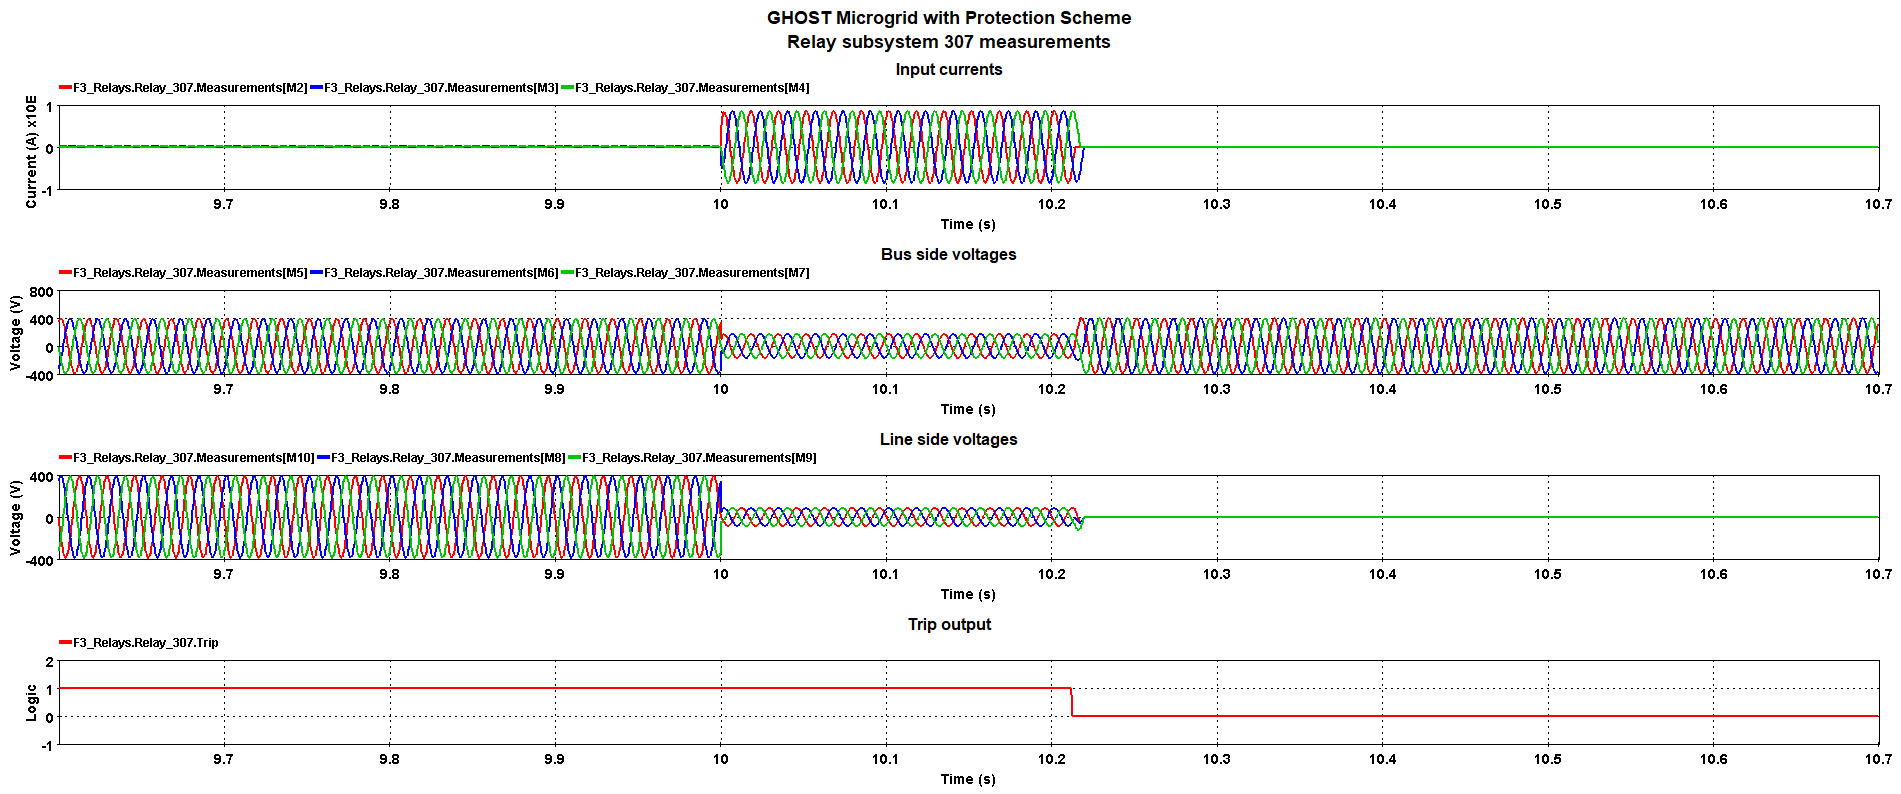
The protection scheme of the Circuit Breaker (CB) connected close to the fault, detects this fault, and responds. As per the relay settings mentioned, the 51P overcurrent protection element responds correctly as shown in the figure below. Multi-relay block 307 issues trip output at time t = 10.21 s, thus isolates the fault.
It can be seen in the figure below that the multi-relay block 307 corresponding to CB 07 of the feeder 3 which is immediate near to the fault, picks up at t = 10.21 s, and clears the fault.
It can be seen in the figure below that the faulted location is isolated from the rest of the network and the model operates stably.
Scenario 3: At t = 15 s, the solar irradiation of the PV model in Feeder 4 is increased from 0.2 pu to 0.8 pu in steps of 0.15 pu / 0.5 s emulating an increase in the solar irradiance. This is similar to the solar power increasing from morning to noon.
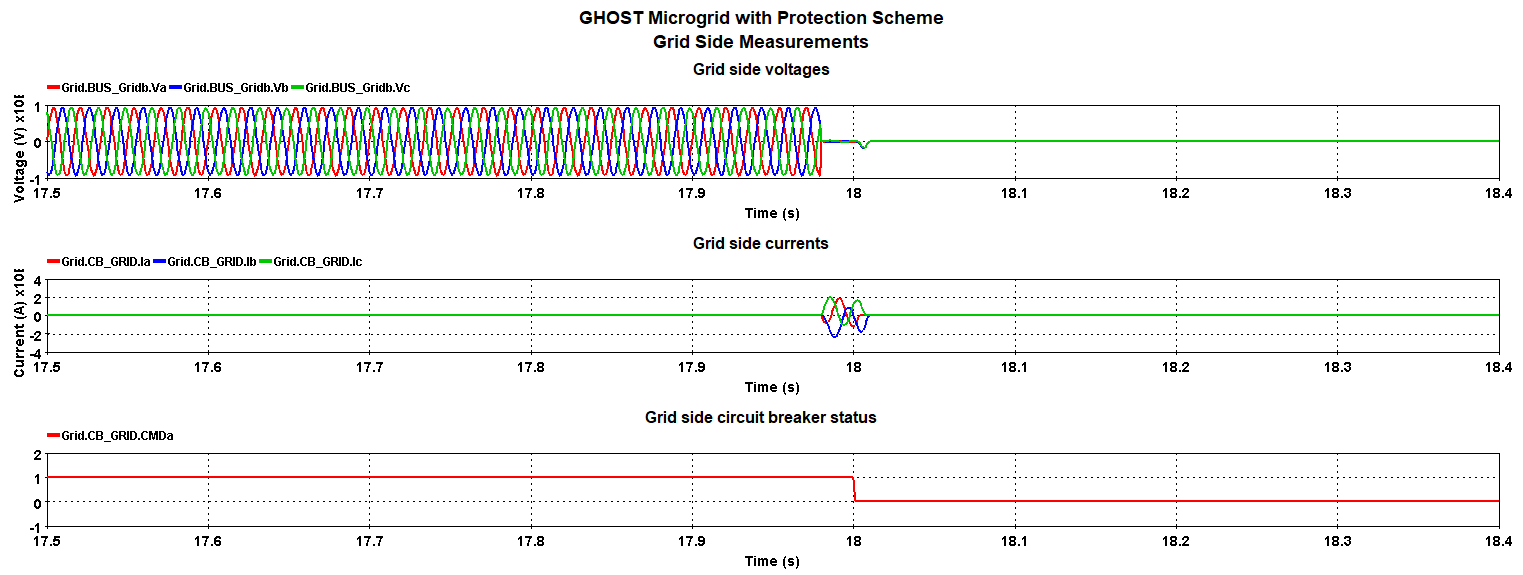
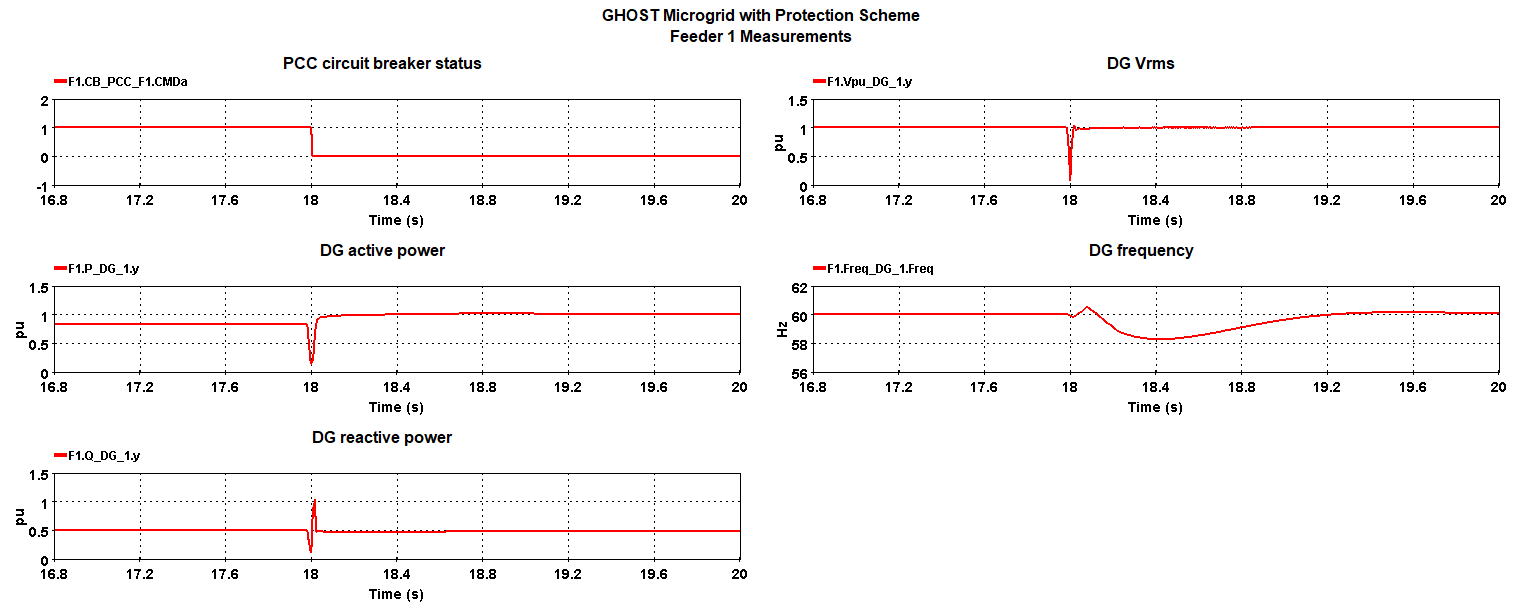
Scenario 4: From time t = 17.98 s to t =18.08 s, a three-phase-ground fault happens at the grid side at location 1 as shown in the above figure. The grid side breakers get open and isolate the complete model into 3 sub-networks (microgrids). The figures below show the results of the various feeders for pre, during, and post-fault conditions. It can be seen that the 3 microgrids work stably and maintain the terminal voltage and frequency while meeting the load demand.
The figure below shows the PCC voltages, currents, and the circuit breaker status :
Feeder 1:
After Feeder 1 PCC breaker opens, the Diesel Generator switches to grid forming mode. Its active power output changes from the previous set-point 0.8 pu to 1 pu to supply the loads.
Feeder 2:
When Feeder 2 turns into an island, BESS reduces its active power output from 0.8 pu to 0.45 pu and increases the reactive power output to supply the loads while maintaining the frequency at 60 Hz and the voltage Vrms at 1 pu.
Feeder 3:
When Feeder 3 turns into an island, the active power of CHP changes from the previous set-point of 0.8 pu to 0.88 pu to supply the loads.
Feeder 4:
The feeder 4 PV observes a transient at t = 18 s caused by the opening of the Feeder 3 PCC breaker. However, the DERs controller quickly settles the system at the reference set points.
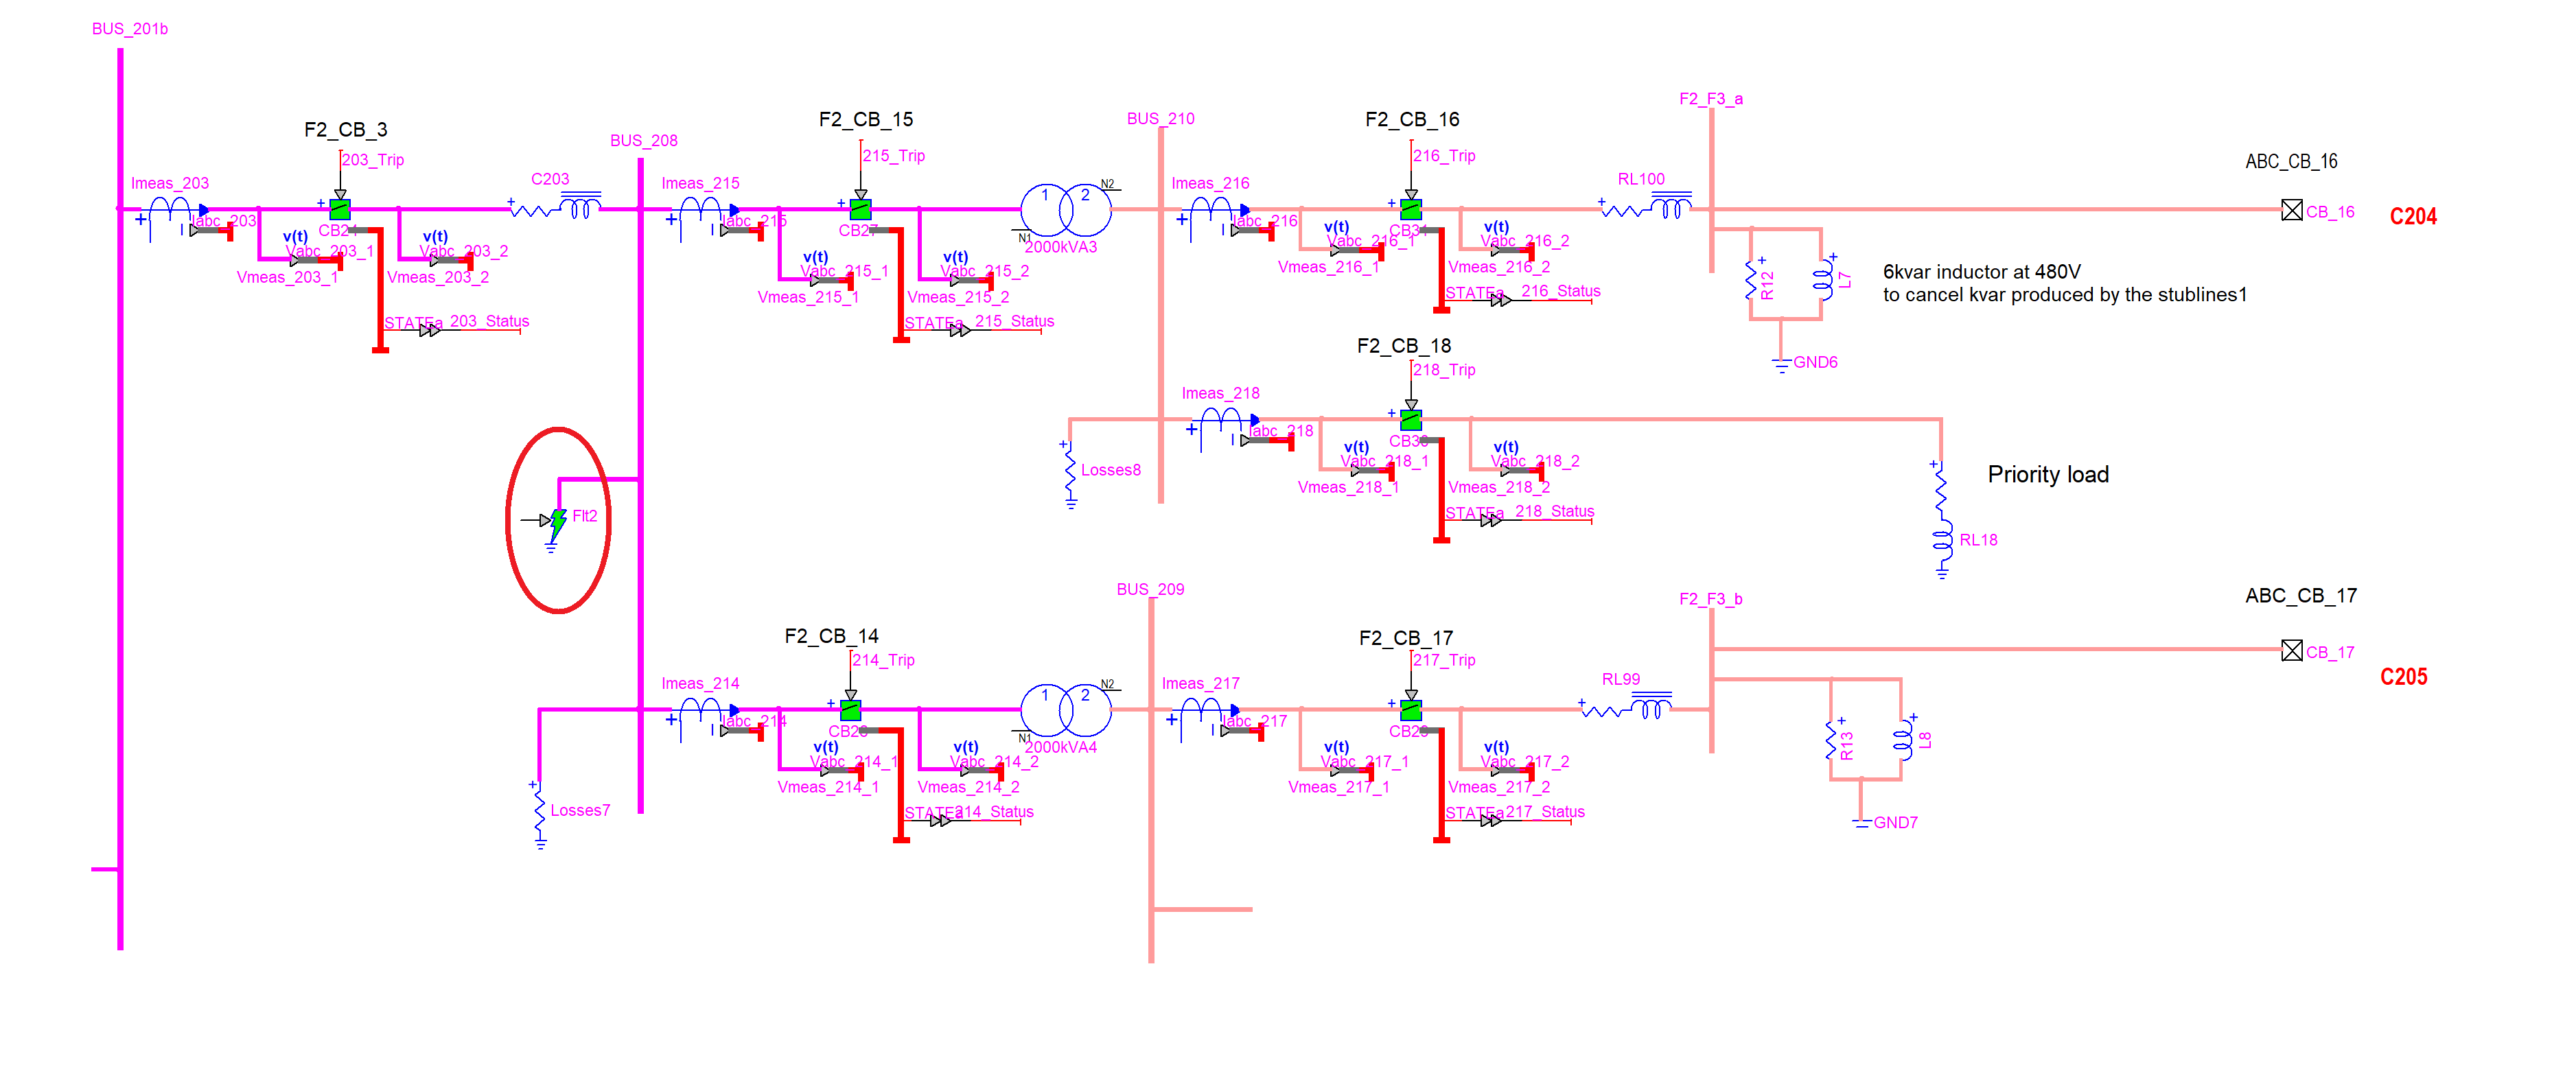
Scenario 5: From time t = 27.00 s to t = 32.00 s, a three-phase-ground fault happens at the BUS 206 of Feeder 2 as shown in the figure below.
The protection scheme of the Circuit Breaker (CB) 03 connected close to the fault, detects this fault and responds. As per the relay settings mentioned, the 51P overcurrent protection element of multi-relay block 203 responds correctly and issues the Trip at time t = 27.91 s, thus isolating the fault. The fault also triggers the 27-Undervoltage element associated with multi-relay subsystems 214, 215, and 218 and thus opens the breakers 14, 15, and 18 after a set time delay of 2 s i.e. at t = 29 s.
It can be seen that the faulted location is isolated from the rest of the network and the model works stably.
Real-Time Execution
It is recommended to use 6 cores to run this model in real-time on a simulator. Also, the performance may vary depending on the simulator specifications.
References
[1] 2017 Microgrid Controller Procurement Information Packet Volume 1.6, P. Koralewicz, ed.: NREL, 2017. [Online].
[2] R. Salcedo et al., "Banshee distribution network benchmark and prototyping platform for hardware-in-the-loop integration of microgrid and device controllers," in The Journal of Engineering, vol. 2019, no. 8, pp. 5365-5373, 8 2019.
OPAL-RT TECHNOLOGIES, Inc. | 1751, rue Richardson, bureau 1060 | Montréal, Québec Canada H3K 1G6 | opal-rt.com | +1 514-935-2323
Follow OPAL-RT: LinkedIn | Facebook | YouTube | X/Twitter