Documentation Home Page ◇ HYPERSIM Home Page
Pour la documentation en FRANÇAIS, utilisez l'outil de traduction de votre navigateur Chrome, Edge ou Safari. Voir un exemple.
Examples | IEC 61850 Substation Automation System (SAS) with MMS
- Sylvain Ménard
Location
This example model can be found in the software under the category "Protection" with the file name "IEC61850_SAS_MMS.ecf".
Pre-requisite
This example model is about IEC 61850 implementation and uses IEC 61850 terms such as GOOSE, Sampled Values, MMS, etc and HYPERSIM features such as the I/O Interface configuration for IEC 61850 V2 Interface and Target I/O Interface library component for mapping. It is highly recommended the reader of the documentation has knowledge about the standard and knows about the features in HYPERSIM.
- To learn more about the HYPERSIM new IEC 61850 I/O interface, please refer to: IEC 61850 page.
- For information about the Target I/O Interface component from the HYPERSIM library and how it is used for linking component sensors to data from the I/O interface, please refer to Target I/O Interface page.
- To use the MMS reports and communicate with a client like an HMI, a HYPERSIM target license with MMS Server enabled is required.
- If the target does not have an MMS license, in the I/O Interface configuration, the report control blocks have to be disabled and the data that is added as MMS data point has to be cleared as well.
- the OPAL-RT IEC 61850 tool simulates MMS Servers which can communicate with MMS client(s). So, an MMS client is needed to show the data that the model is sending such as measurements and to send control signals to the Servers to change a value in the model. Any IEC 61850 simulation tool that can act as an MMS client can be used to communicate with MMS servers. But in this example model, for MMS control, a free tool called "IED Explorer" is used. The tool can be found and downloaded for free. The version that is used for this example model is: IED Explorer 0.79m. Instructions on how to use it are in Using IED Explorer in this documentation.
Description
Model introduction
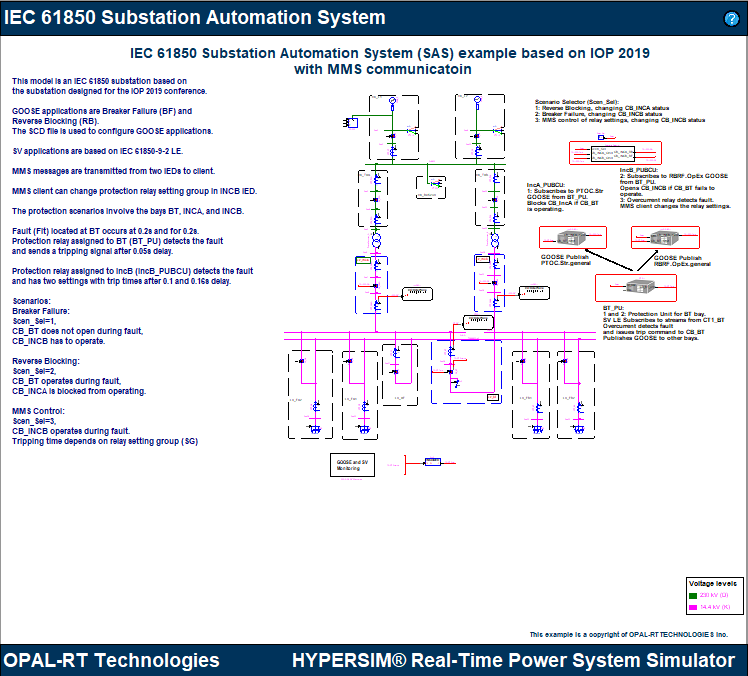
This model is an example of integrating an IEC 61850 Substation Automation System (SAS) in HYPERSIM. The substation that was used for this purpose is an example that was made during the Interoperability (IOP) conference in 2019 [1]. More information about the substation's origins can be found here: IOP2019.
The substation automation is designed by a system configuration tool (SCT) with use of IED files (CID, ICD) from IED configuration tools (ICT) from their respective manufacturers.
In order to implement the design in HYPERSIM, the following steps are taken:
- Single line diagram is designed using HYPERSIM library components that match the power equipment from the SCD file.
- SCD file is imported in the IEC 61850 v2 I/O interface in HYPERSIM.
- Some GOOSE messages and report control blocks from the SCD file are enabled and Sampled Value streams are created in the interface.
- Different scenarios for protection and communication are designed between IEDs by using the HYPERSIM library parts.
- Target I/O interface block is used to link HYPERSIM components' sensors to the IEC 61850 data attributes from communication that is enabled in the I/O interface.
This document shows the information about the substation and how the communication and protection scenarios are configured.
The substation contains the following structure:
- Two voltage levels: 230kV, 14.4kV
- Two power transformers
- Three busbars: 230 kV BUS at 230 kV voltage level, Transfer BUS XF, 14.4 kV BUS A, and 14.4 kV BUS B.
- Twelve bays:
- At 230kV:
- L1, L2 (Line)
- BP (Busbar Protection)
- TXA, TXB (Transformer Protection)
- At 14.4 kV:
- IncA, IncB (Incomer)
- BT (Tie Breaker)
- XF (Busbar XF Protection)
- A1, A2, B1, B2 (Feeder at busbars 14.4 kV BUS A and BUS B)
- At 230kV:
- IEDs (Intelligent Electronic Devices):
- Multiple IEDs at each bay are in charge of protection (PU), control (BCU) or both (PUBCU) depending on the type of IED. Merging units (MU) are located in the process level and they are in charge of digitizing current and voltage values from instrument devices and transferring them via sampled values to bay units.
Bays and IEDs in HYPERSIM
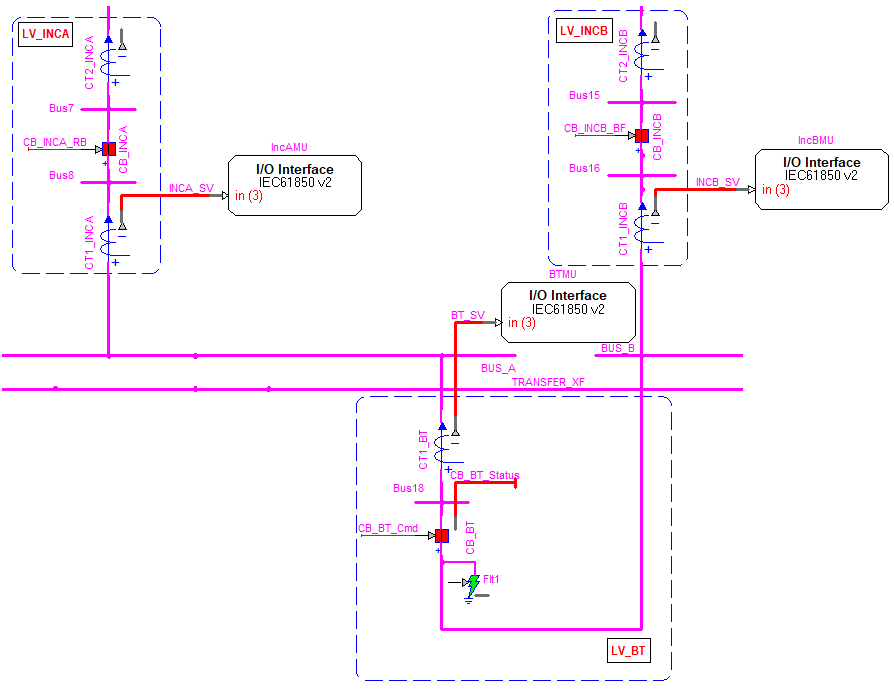
In the HYPERSIM model, only three bays and their respective IEDs are involved in the scenarios that are designed. They are located at the low voltage (LV) side of the substation which is 14.4 kV. HYPERSIM components are used to create internal logic and IEC 61850 communication section of the IEDs which are grouped as subcircuits. The Target I/O interface component block is used in place of a merging unit and in general for IEC 61850 data mapping to component sensors.
The table below gives a summary of the bays and IEDs that are involved in this example model. The bay names from the table and subsequent figure have the voltage level name next to them such as LV_BT. This is just to indicate where each bay is located in regards to voltage level in a way to interpret the IEC 61850 single line diagram hierarchical naming in HYPERSIM.
| Bay name | IED name |
|---|---|
| LV_BT (BT) | BTMU |
| BT_PU | |
| LV_INCA (INCA) | IncAMU |
| IncA_PUBCU | |
| LV_INCB (INCB) | IncBMU |
| IncB_PUBCU |
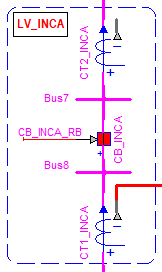
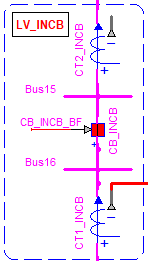
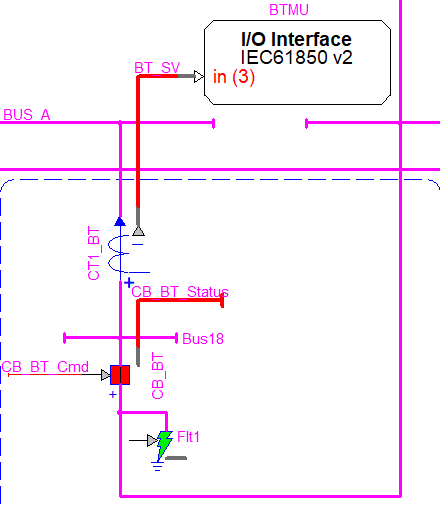
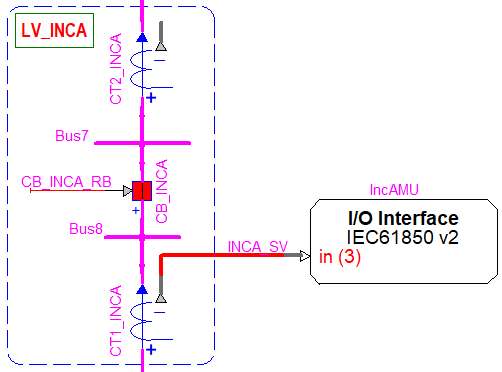
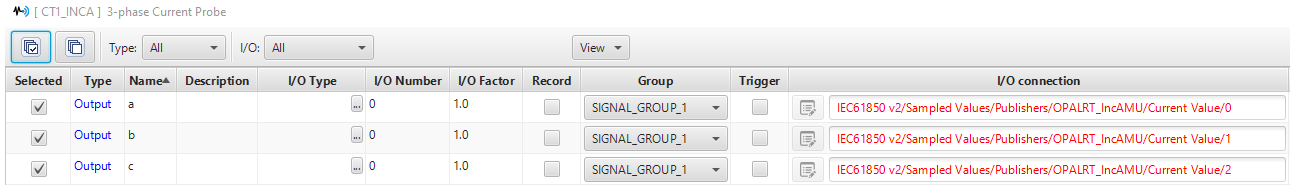
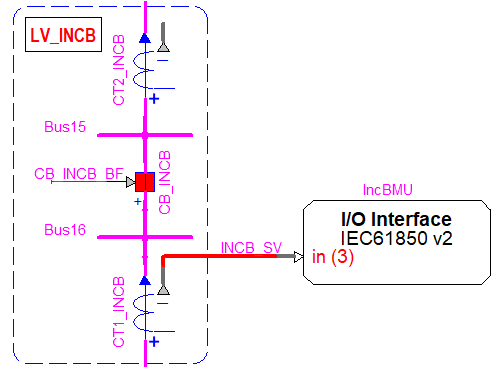
The following picture shows the three bays and Target I/O interfaces as merging units which are connected to the current transformers. Each equipment is named to represent the name of their respective bays, eg CT1_INCA, CB_INCA, etc. 3-phase Breakers are chosen for circuit breakers and 3-phase Current Probes are used to represent current transformers. The busbars at 14.4kV are named: BUS_A, BUS_B, and TRANSFER_XF.
The following table of figures below shows the IED subcircuits which are the protection units that are assigned to each bay.
|
|
|
|
|
|
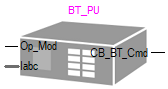
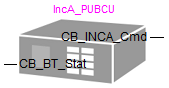
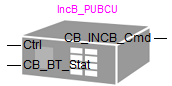
As mentioned, each IED is a group of HYPERSIM library components which provide internal logic of the device. The IEDs BT_PU and IncB_PUBCU contain overcurrent protection relays from the HYPERSIM library.
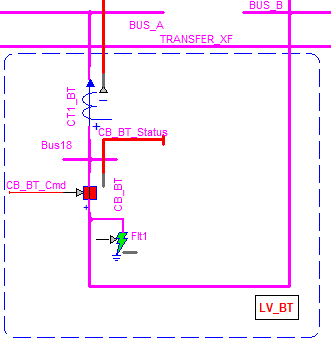
Fault
In addition to devices used for IEC 61850 data mapping and engineering, there is also a fault at the bay BT. It is triggered at 0.2 seconds with the trigger option in ScopeView Acquisition and lasts 0.2 seconds.
IEC 61850 v2 I/O Interface
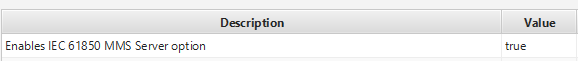
HYPERSIM I/O Interface Configuration is used to create an IEC 61850 interface. GOOSE and MMS communication from the SCD file are imported via IEC 61850 interface and IEC 61850-9-2 LE is used to configured SV streams. The IEC 61850 v2 interface allows enabling data attributes from the IED data model to be sent as MMS inputs or outputs and this is how the commands from an MMS client are received.
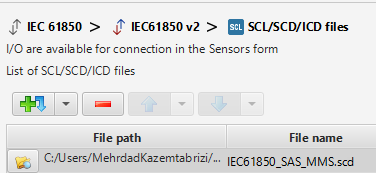
The SCD file is called "IEC61850_SAS_MMS.scd".
NOTE: Only the relevant parts of the interface to the example model are shown in this page. To learn more about how the I/O interface configuration works, please refer to IEC 61850 page in Confluence.
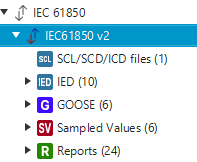
SCL and IED
SCL files
IED - List of IEDs (MMS Servers)
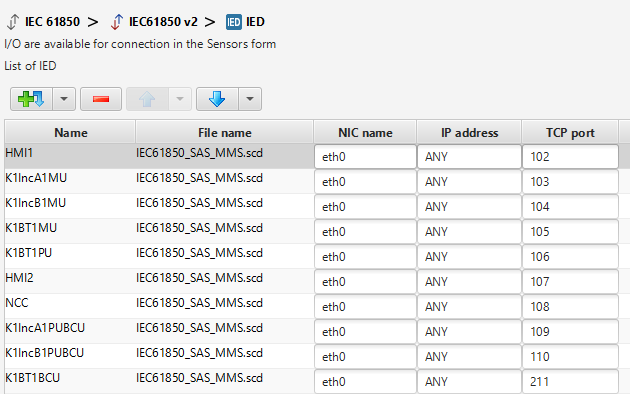
The TCP ports in the IED section are used to establish a connection between the IED and MMS client. As it can be seen, the ports for IEDs that are used in this example model are as follows:
| IED name in HYPERSIM model | IED name in SCD file | TCP Port |
|---|---|---|
| IncA_PUBCU | K1IncA1PUBCU | 109 |
| IncB_PUBCU | K1IncB1PUBCU | 110 |
IED - IED data model (MMS data points)
The IED IncB_PUBCU is also receiving communication from the MMS client. One of the data attributes from its data model is used to receive communication from the MMS client and is shown in the following picture.
The data attribute is called "StrVal.SetMag.f". This data is related to an overcurrent protection function's pickup current and is a type of data that can be written by the MMS client. In this example, it is used for changing setting groups of the overcurrent relay in the IED IncB_PUBCU. For more information about these kinds data and how they are used, refer to the standard IEC 61850-7-2.
As it is shown in the picture, it is added as an MMS data point in the IED section of the I/O interface for IncB_PUBCU IED.
|
|
|---|
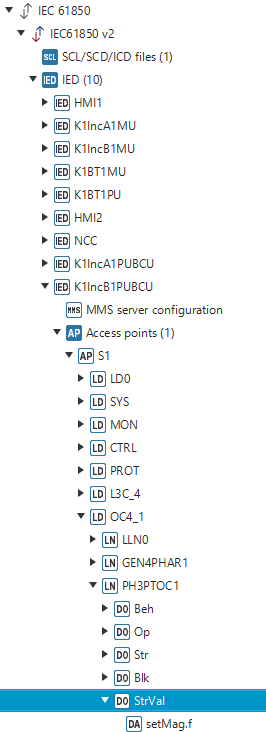
IMPORTANT NOTE: If the target does not have license for MMS server, the Add MMS data point option has to be disabled. Otherwise, the model cannot run.
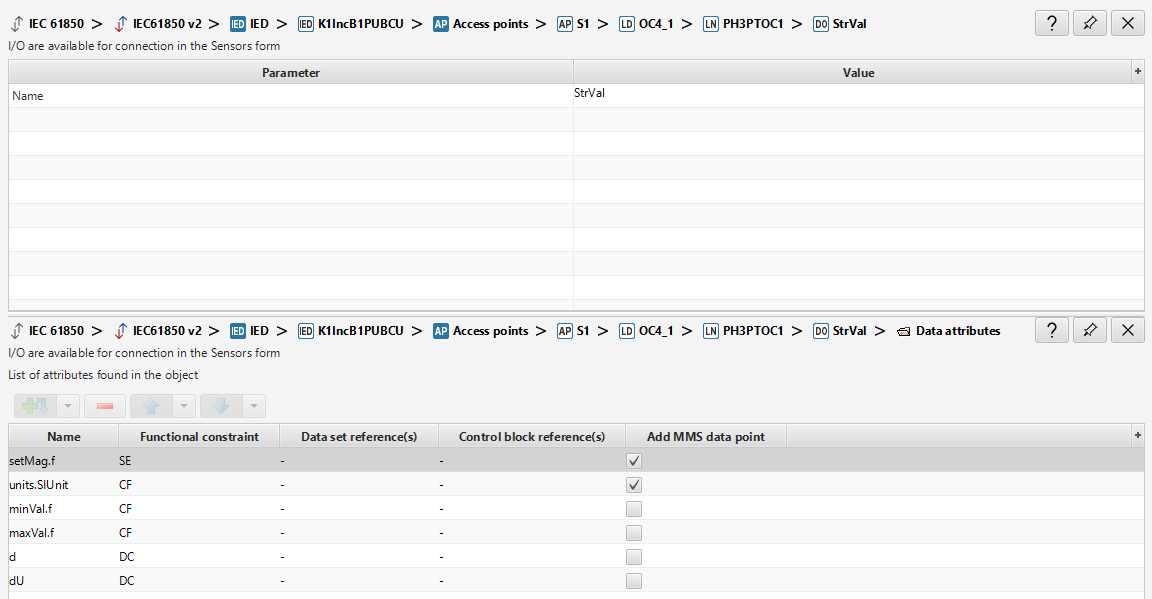
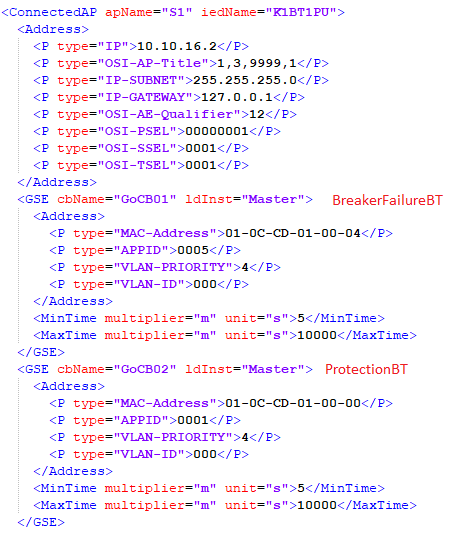
GOOSE
As it is shown, only two GOOSE control blocks are enabled and used in this example model:
| GOOSE ID | HYPERSIM Scenario |
|---|---|
| BreakerFailureBT | Breaker Failure |
| ProtectionBT | Reverse Blocking |
Sampled Values
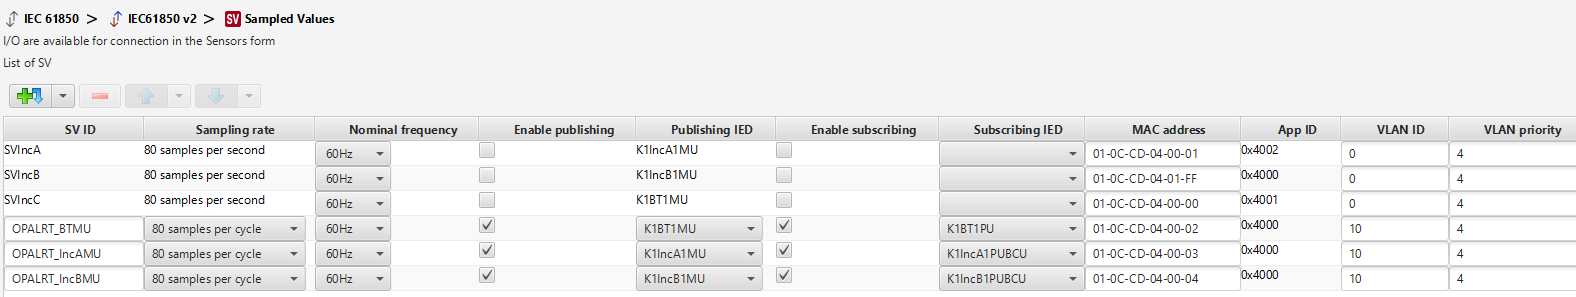
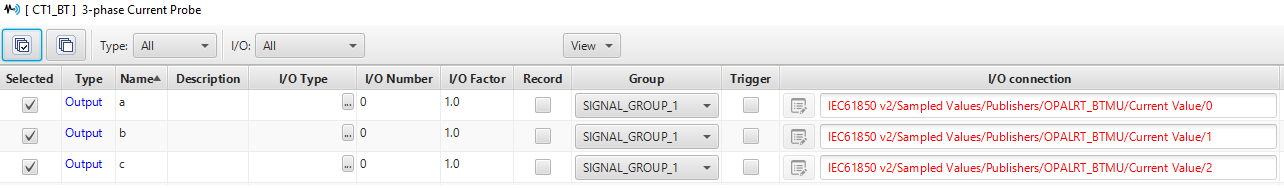
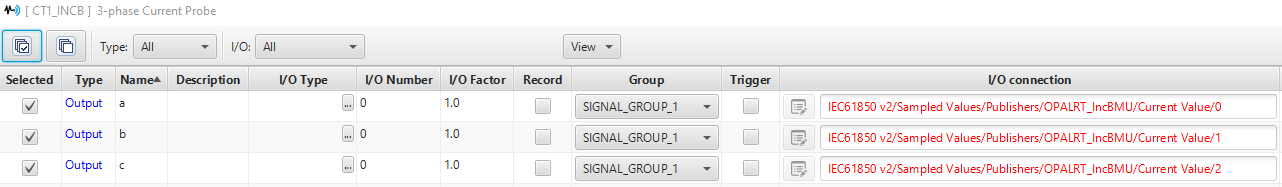
Sampled Values IEC 61850-9-2 Light Edition (LE) Sampled Values are used in this example model. Three streams are enabled to be published by merging units and subscribed to by IEDs at the three bays. In HYPERSIM, the current transformers (CT) publish these streams and different components (such as protection relays) at each IED subscribe to them.
| SV LE stream | Publishing CT in HYPERSIM | Subscribing IED in HYPERSIM |
|---|---|---|
| OPALRT_BTMU | CT1_BT | BT_PU |
| OPALRT_IncAMU | CT1_INCA | IncA_PUBCU |
| OPALRT_IncBMU | CT1_INCB | IncB_PUBCU |
MMS Reports
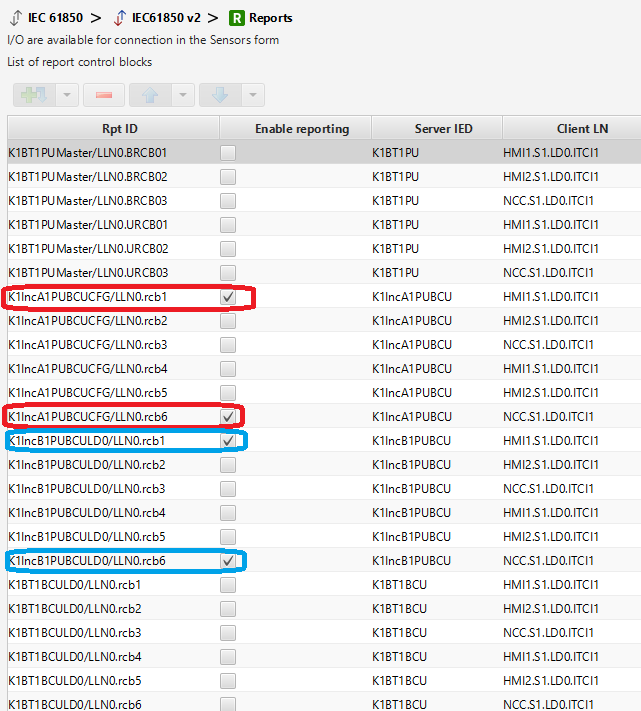
Only two report control blocks from the IEDs IncA_PUBCU and IncB_PUBCU are enabled and used in the example model. There are a lot of report control blocks in the SCD file for each IED because in the configuration tool, there are a few clients and some reports are redundant to be used as backup.
| IED name in SCD | IED name in HYPERSIM | Report Control Block (RCB) | RCB content used in model | Data attribute type |
|---|---|---|---|---|
| K1IncA1PUBCU | IncA_PUBCU | rcb1 | P1PTOC.Str.general | Binary |
| rcb6 | MMXU.A.Phs(A,B,C) | Analog | ||
| K1IncB1PUBCU | IncB_PUBCU | rcb1 | RBRF.OpEx.general | Binary |
| rcb6 | MMXU.A.Phs(A,B,C) | Analog |
NOTE: Data sets of the report control blocks can be found in the IED section of the interface.
IMPORTANT NOTE: If the target does not have license for MMS server, the report control blocks have to disabled. Otherwise, the model cannot run.
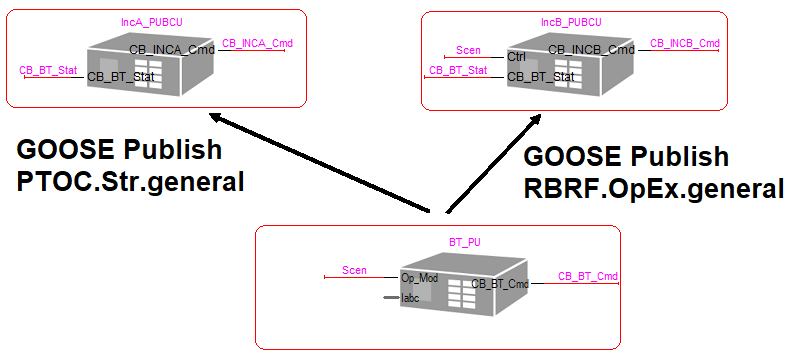
Protection Applications (Scenarios)
There are three protection scenarios in this example model and they involve three IEDs: BT_PU, IncA_PUBCU, and IncB_PUBCU.
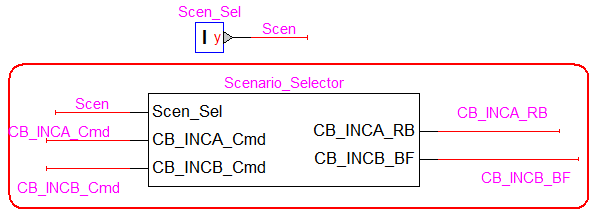
Scenario Selection
The scenarios can be selected by changing the value of the constant block "Scen_Sel". The selector is located at the top right of the model page.
| Scenario Name | Scen_Sel | Explanation | IEDs in the scenario | Breakers in the scenario | IEC 61850 communication | IEC 61850 data |
|---|---|---|---|---|---|---|
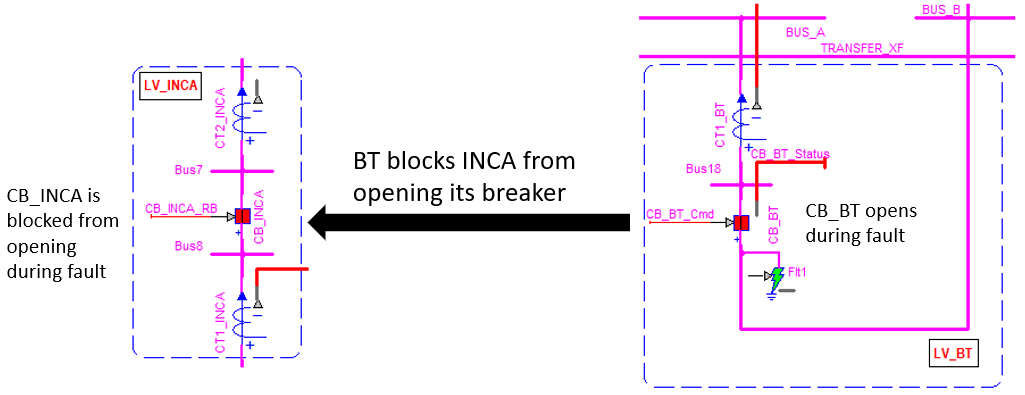
| Reverse Blocking (RB) | 1 | Fault occurs at the bay BT. The overcurrent relay at BT_PU sees the fault and sends a tripping signal to the breaker at BT (CB_BT). CB_BT opens normally. Fault is seen by the bay INCA. Since CB_BT opens as intended, the breaker at INCA (CB_INCA) is blocked from opening. | BT_PU (overcurrent relay) IncA_PUBCU | CB_BT CB_INCA | GOOSE Application: ProtectionBT | PTOC.Str.ST.general |
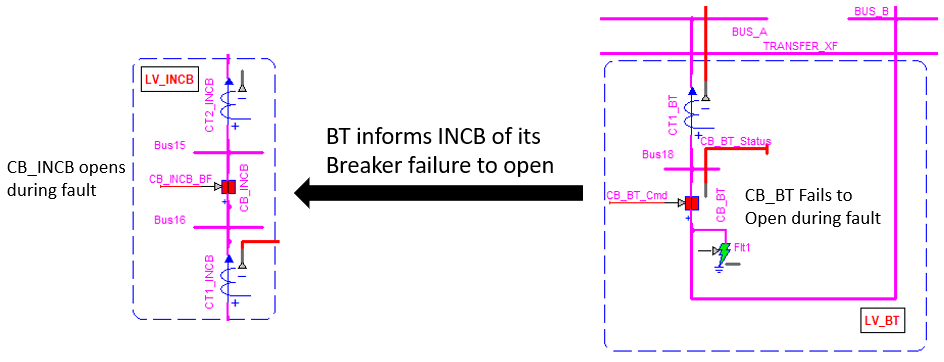
| Breaker Failure (BF) | 2 | Fault occurs at the bay BT. The overcurrent relay at BT_PU sees the fault and sends a tripping signal to the breaker at BT (CB_BT) . CB_BT fails to open as intended. Fault is seen by the bay INCB. Since CB_BT does not open, the breaker at INCB (CB_INCB) opens to cut of the line and isolate the fault. | BT_PU (overcurrent relay) IncB_PUBCU | CB_BT CB_INCB | GOOSE Application: BreakerFailureBT | RBRF.OpEx.ST.general |
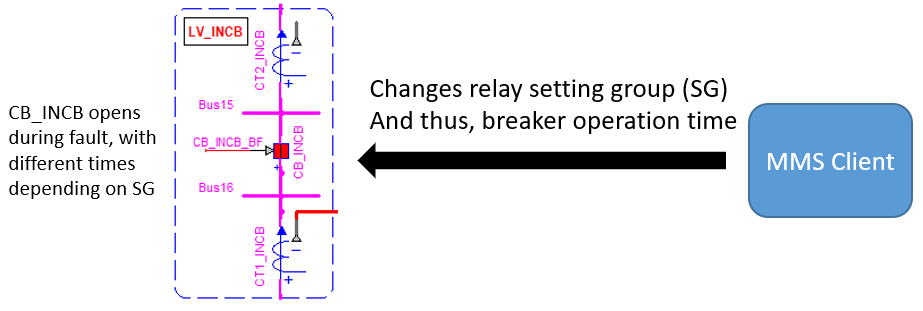
| MMS Control | 3 | Fault occurs at the bay BT. Fault is seen at INCB. The overcurrent relay at IncB_PUBCU sees the fault and sends a tripping signal to the breaker at INCB (CB_INCB). The relay has two overcurrent setting groups (SG) . They can be changed by an MMS client by writing the value of a data attribute. Tripping time and so the breaker opening time differs depending on the SG. | IncB_PUBCU (overcurrent relay) | CB_INCB | MMS command: Change Setting Groups | PTOC.StrVal.SE.SetMag.f |
IncB_PUBCU relay setting groups in Scenario 3
This relay is only involved in Scenario3. The following table shows the setting groups for its overcurrent protection.
| Setting Group | Overcurrent type | Parameters | Expected Trip time | Value sent by MMS Client | IEC 61850 data |
|---|---|---|---|---|---|
| SG1 | Definite Time Overcurrent | Time delay = 0.1 s | 0.3 s | 1 | PTOC.StrVal.SE.SetMag.f |
| SG2 | Inverse Time Overcurrent | US Short Time Inverse (U5) | 0.36 s | 2 |
Simulation and Results
This section shows how to run the simulation and view the results for each scenario. The fault at BT bay will trigger at 0.2 seconds for 0.2 seconds. Depending on the protection scenario that is selected, the breaker operation at BT, IncA, and IncB bays are shown in this section.
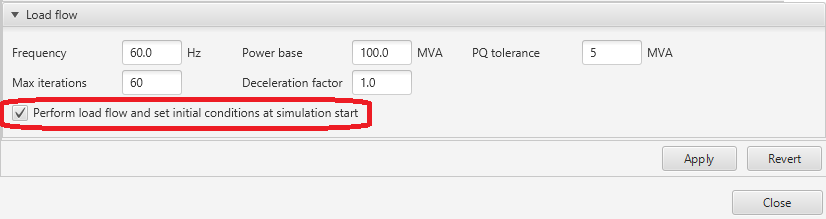
The simulation should be run in steady state so make sure the network is initialized by the load flow.
- Open Network → Load Flow, make sure the frequency is at 60 Hz and then press "Execute load flow".


You can also enable performing load flow when simulation starts in the "Simulation Settings".

- Run the simulation in real time on a target in real time.
Scenario 1: Reverse Blocking (RB)
Fault occurs at 0.2 seconds at BT. Fault is seen by both BT_PU and IncA_PUBCU. BT_PU sends tripping signal to CB_BT and it opens successfully. BT_PU blocks IncA_PUBCU from sending a trip signal to CB_INCA so it does not open.
- Choose Scen_Sel = 1.
- Open Template IEC61850_SAS_MMS.svt from the project folder.
- Open ScopeView, click on both Sync and Trig to make sure fault is triggered at 0.2 seconds.
- Do an acquisition by pressing on the Play button on that ab "BT_Relay_Fault"
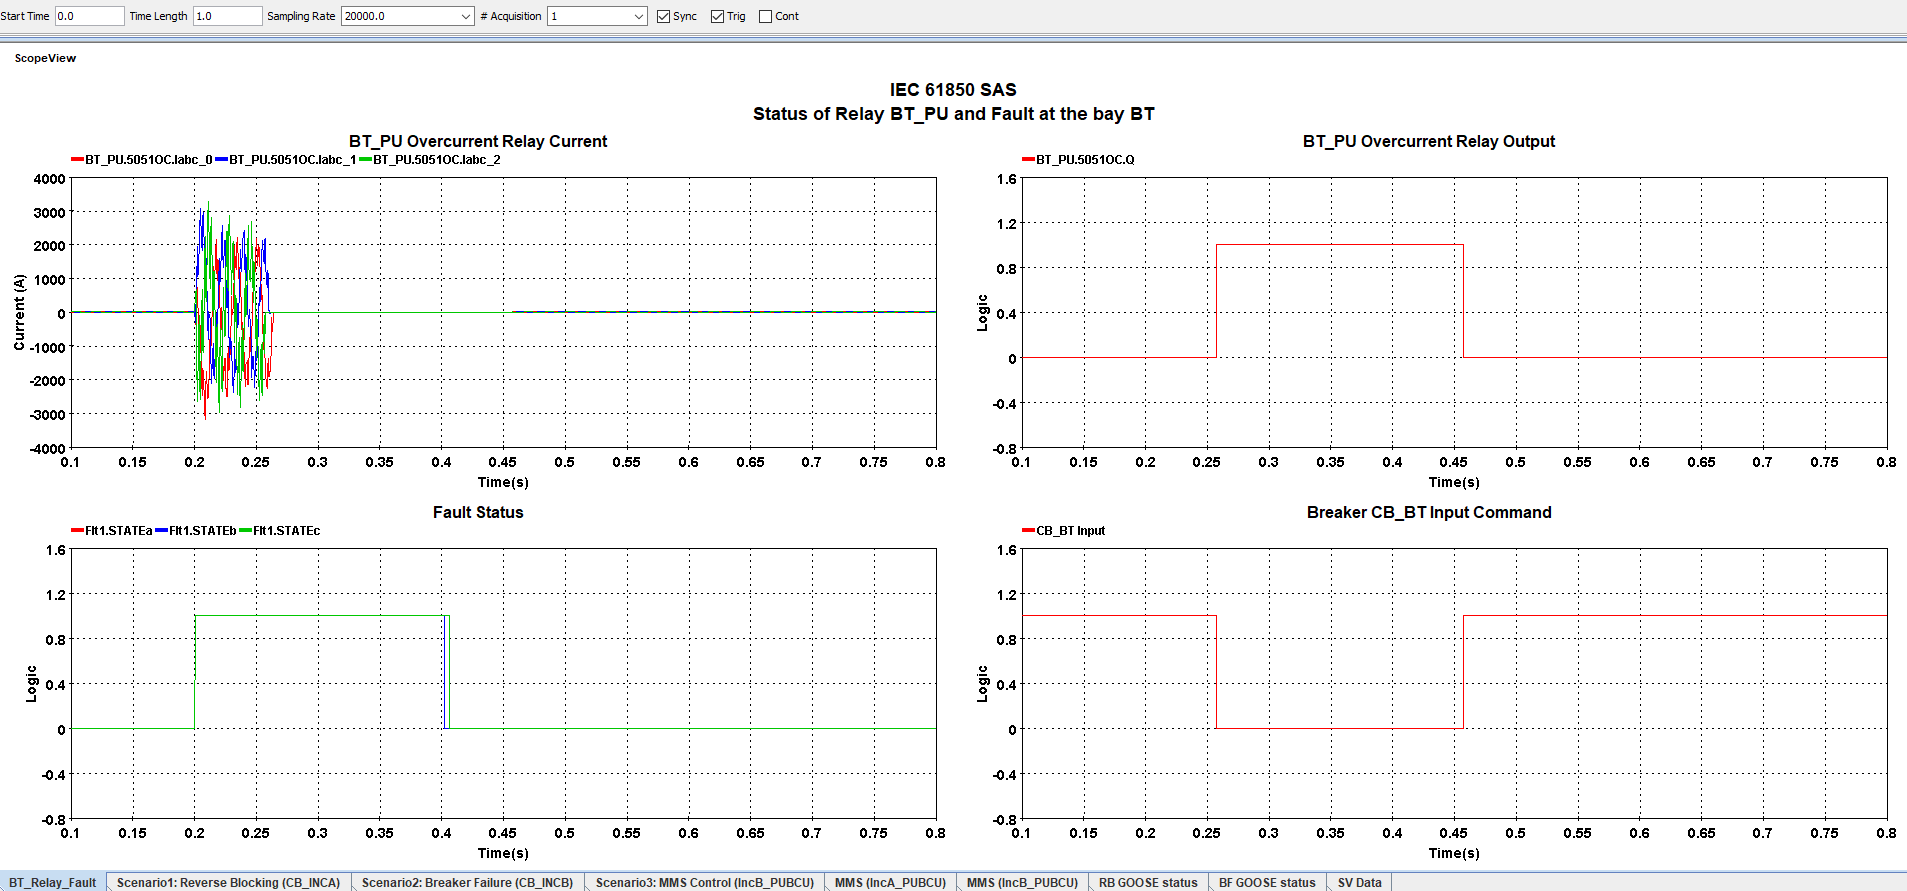
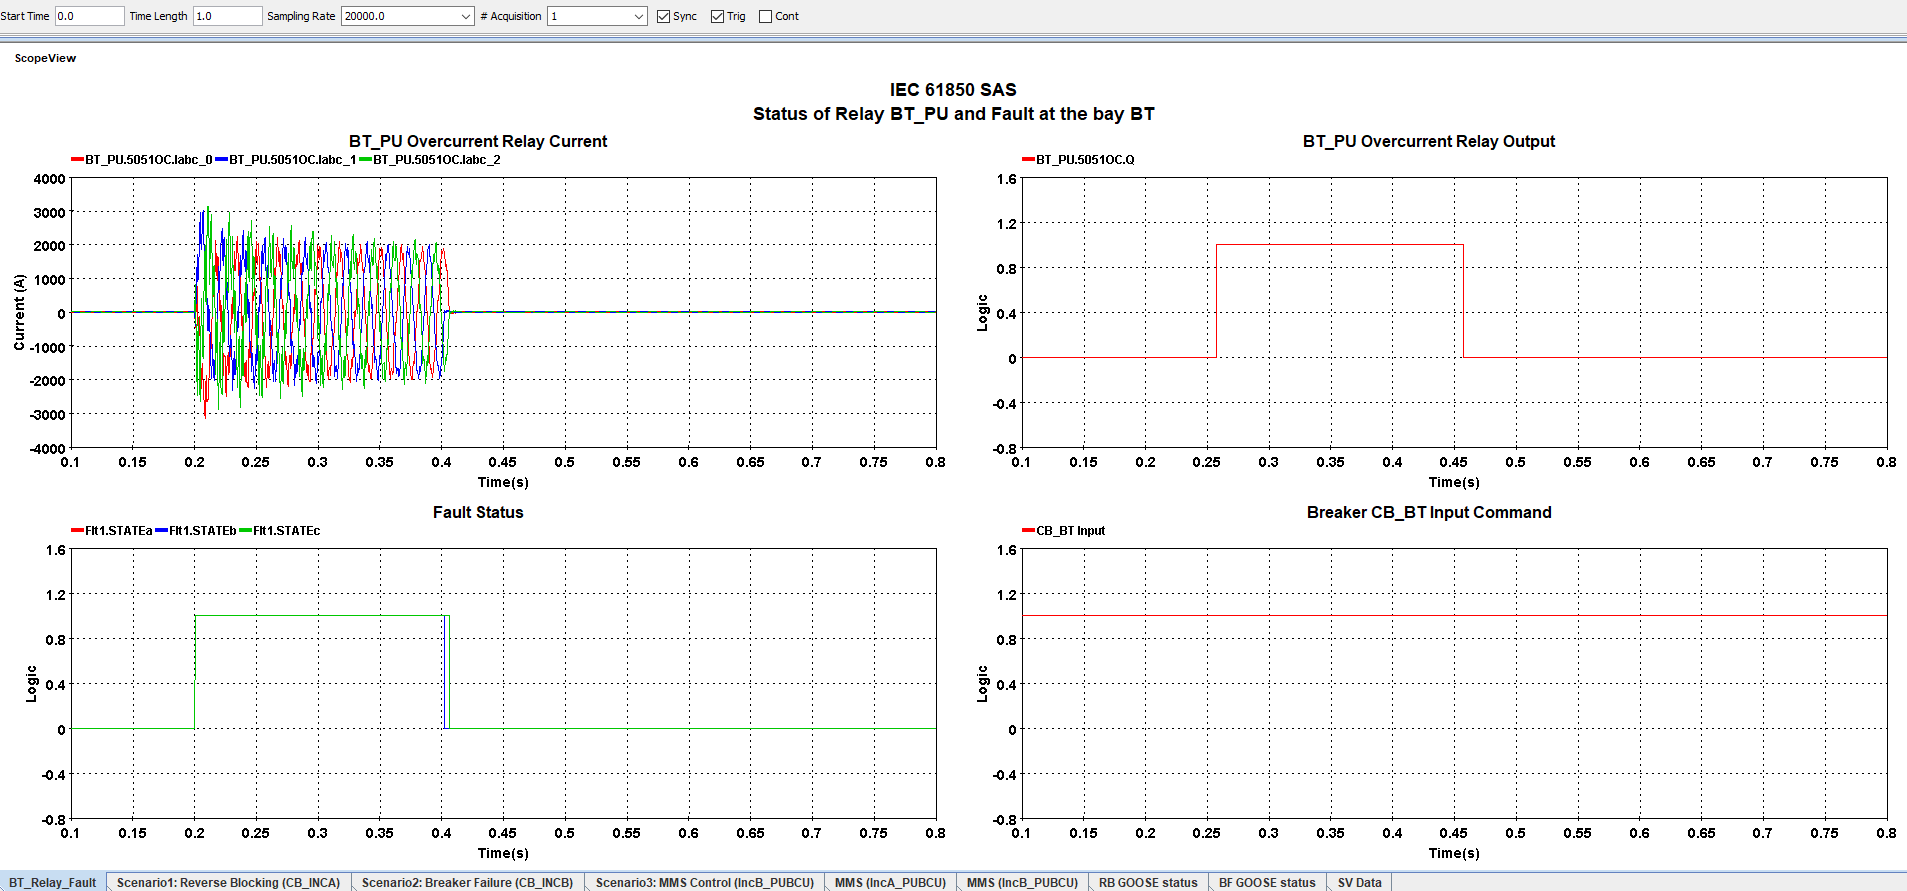
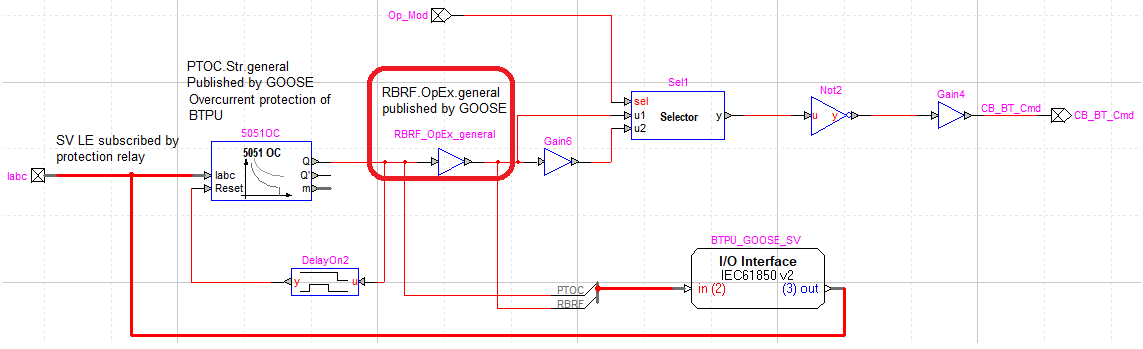
From the diagrams in this tab, the overcurrent relay at BT_PU IED sees the fault current at 0.2 seconds and issues a trip signal after 0.05 second delay (0.05 seconds is its protection relay setting). In the Reverse Blocking scenario, breaker CB_BT receives the trip signal from the relay and opens at 0.25 seconds.
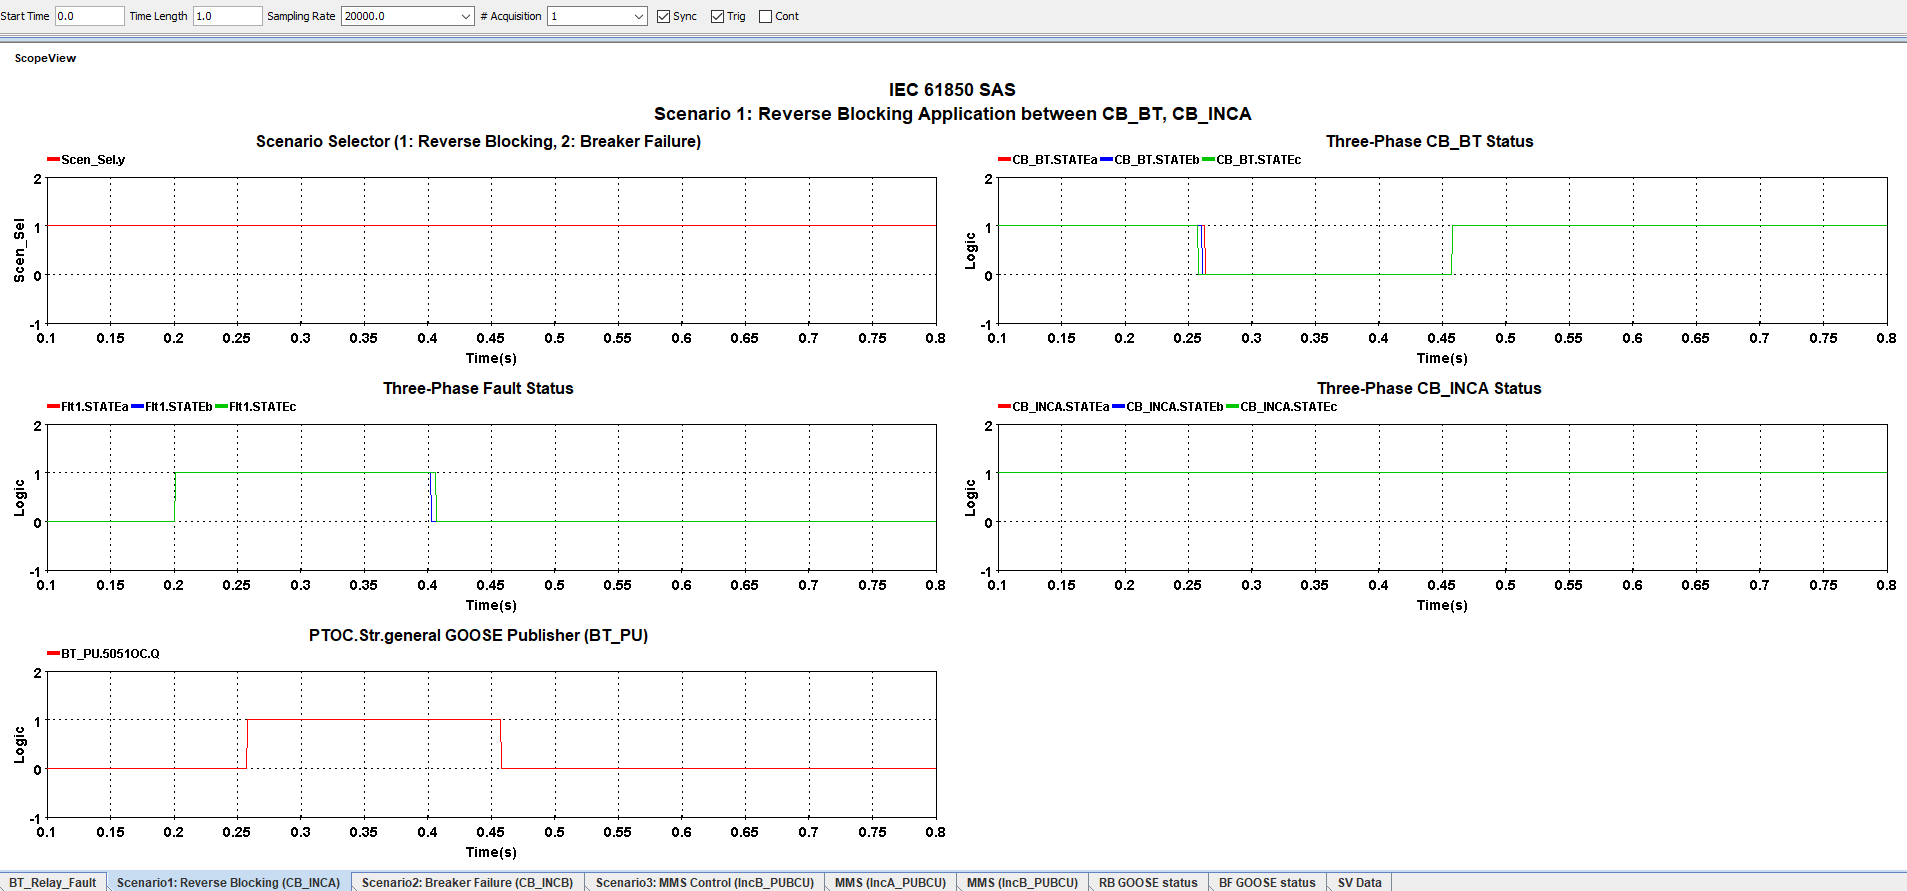
- Open the page "Scenario1: Reverse Blocking (CB_INCA)". This page shows the publishing of GOOSE message containing the data attribute PTOC.Str.general when the relay at BT has issued the tripping signal at 0.25 seconds. This message is sent to IED at IncA. By viewing the operation of CB_BT and CB_INCA, it can be seen that, as expected, CB_BT is open at 0.25 seconds and CB_INCA is blocked and has stayed closed during the fault period.
Scenario2: Breaker Failure (BF)
Fault occurs at 0.2 seconds at BT. Fault is seen by both BT_PU and IncB_PUBCU. BT_PU sends tripping signal to CB_BT and but does not open. IncB_PUBCU sends trip signal to CB_INCA and it opens instead.
- Choose Scen_Sel = 2.
- Make sure the simulation is running and open ScopeView. Make sure the template IEC61850_SAS_MMS is open, view the page BT_Relay_Fault, and do an acquisition.
In this scenario, the overcurrent is seen by the relay and it issues a tripping signal but as it is shown, the breaker CB_BT does not receive the message and so the breaker fails to open.
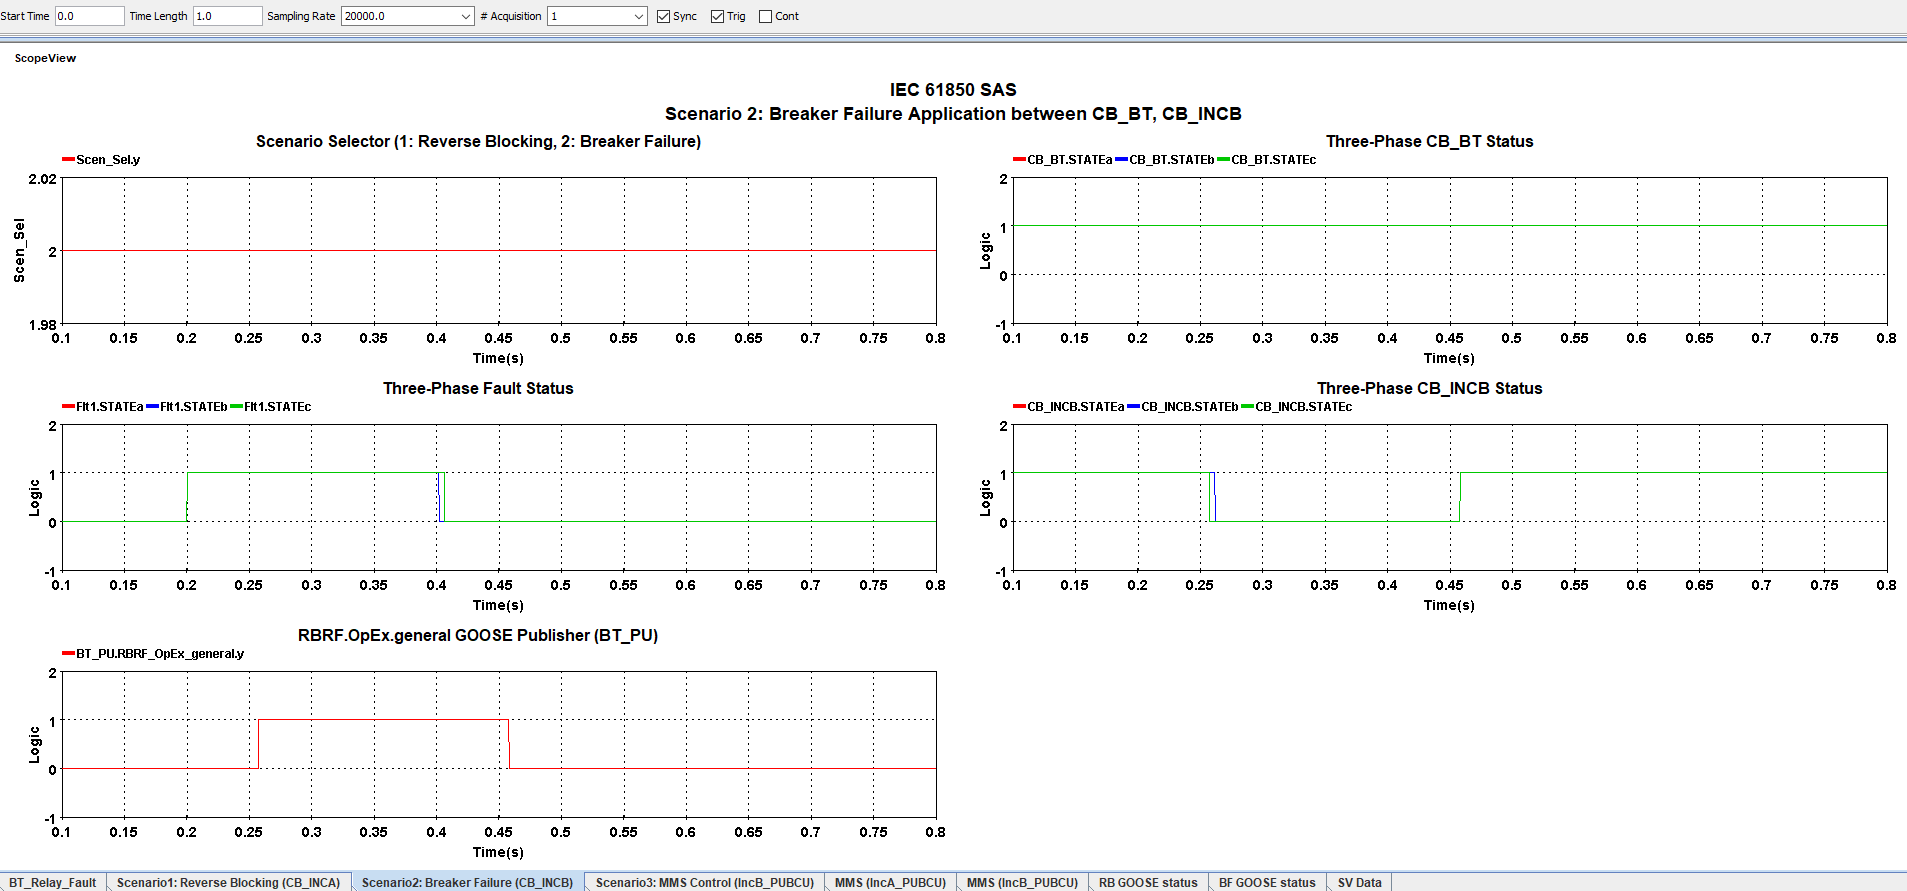
- View the page "Scenario2: Breaker Failure (CB__INCB)". The GOOSE message containing the data RBRF.OpEx.general is published to the bay INCB. As it can be seen, the breaker at BT has failed to open and remained closed. So, the IED at INCB has issued a signal to its breaker CB_INCB to be open instead. It can be seen that at 0.25 seconds, the breaker CB_BT is closed and CB_INCB has opened and thus isolated the fault and protected the busbar.
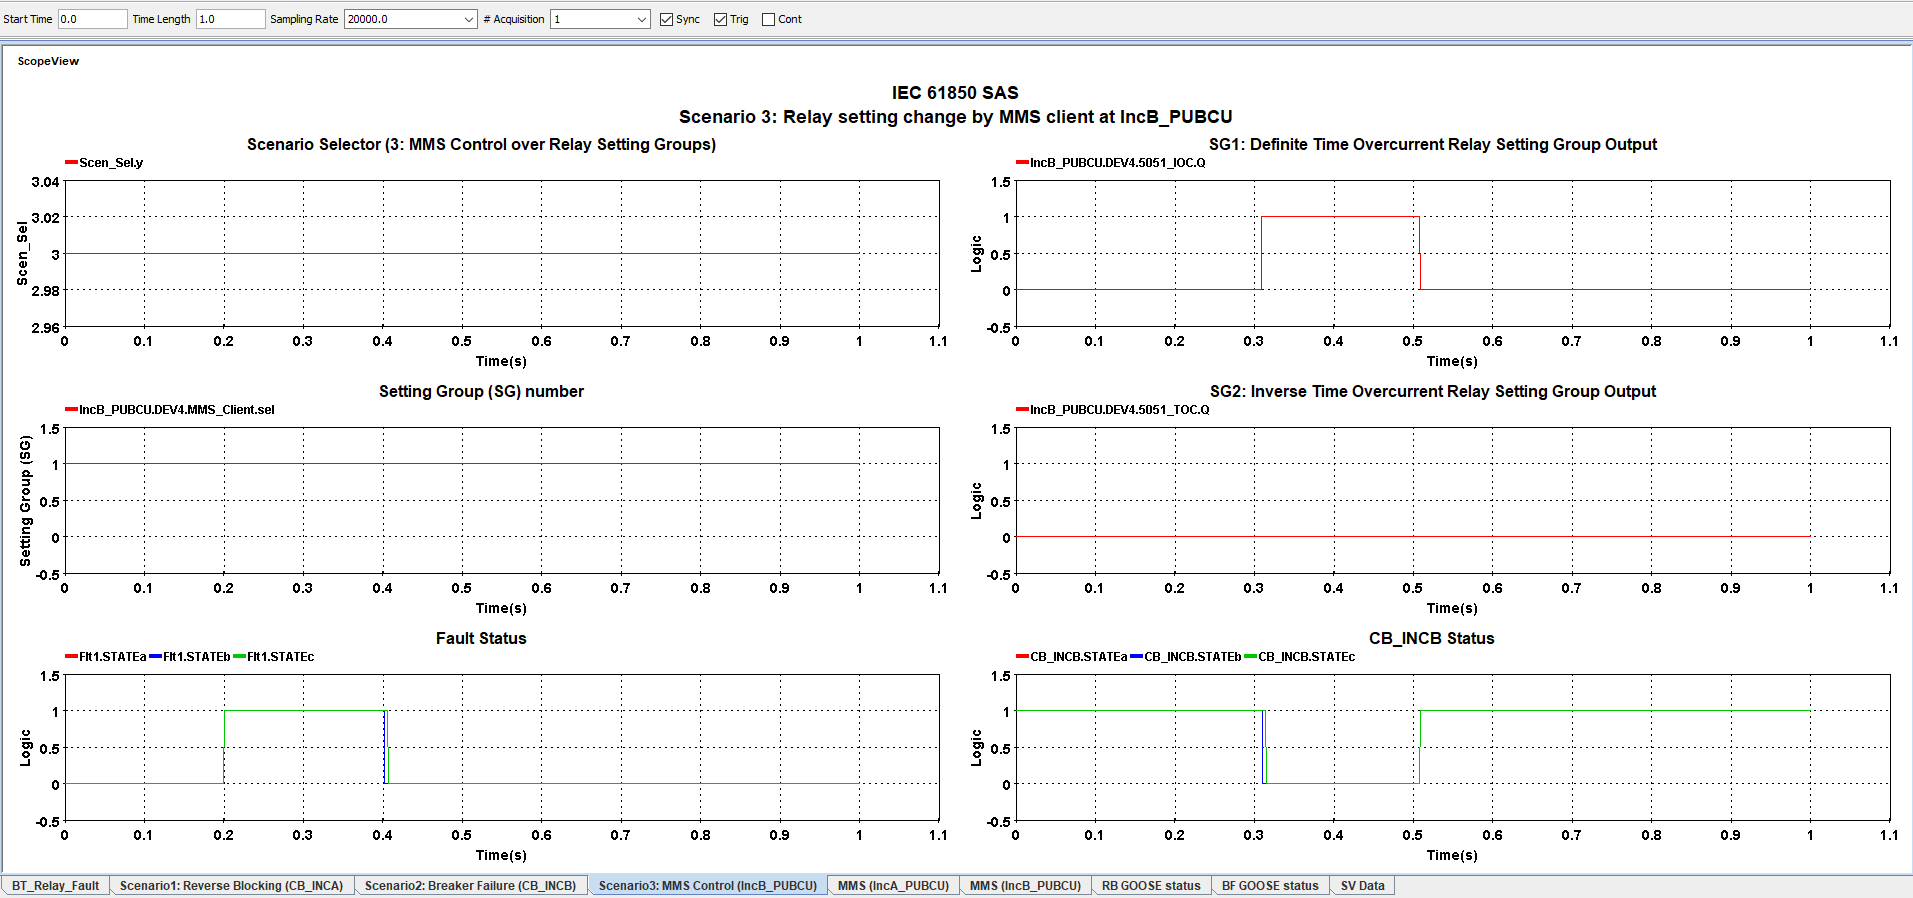
Scenario3: MMS Control
Fault occurs at 0.2 seconds. It is seen by IncB_PUBCU and its overcurrent relay sends trip signal to breaker CB_INCB. Trip time and breaker operation time can differ based on relay setting group (SG). The setting group can be changed between 1 and 2 by MMS Client.
- Choose Scen_Sel = 3.
- Make sure the simulation is running, open ScopeView template SAS_IEC6150_MMS.svt. View the tab Scenario3: MMS Control.
This tab shows the output of the overcurrent relay at IncB_PUBCU. The relay sees the fault and issues a tripping signal to CB_INCB. The trip time depends on the relay setting groups. The graph SG1: Definite Time Overcurrent in this page shows the relay's trip time according to Setting Group 1 (SG1) . The time is about 0.3 seconds which corresponds to the 0.1 second delay of the relay's setting, as shown in IncB_PUBCU Relay Setting Groups. The graph CB_INCB Status shows the breaker CB_INCB opening with this time.
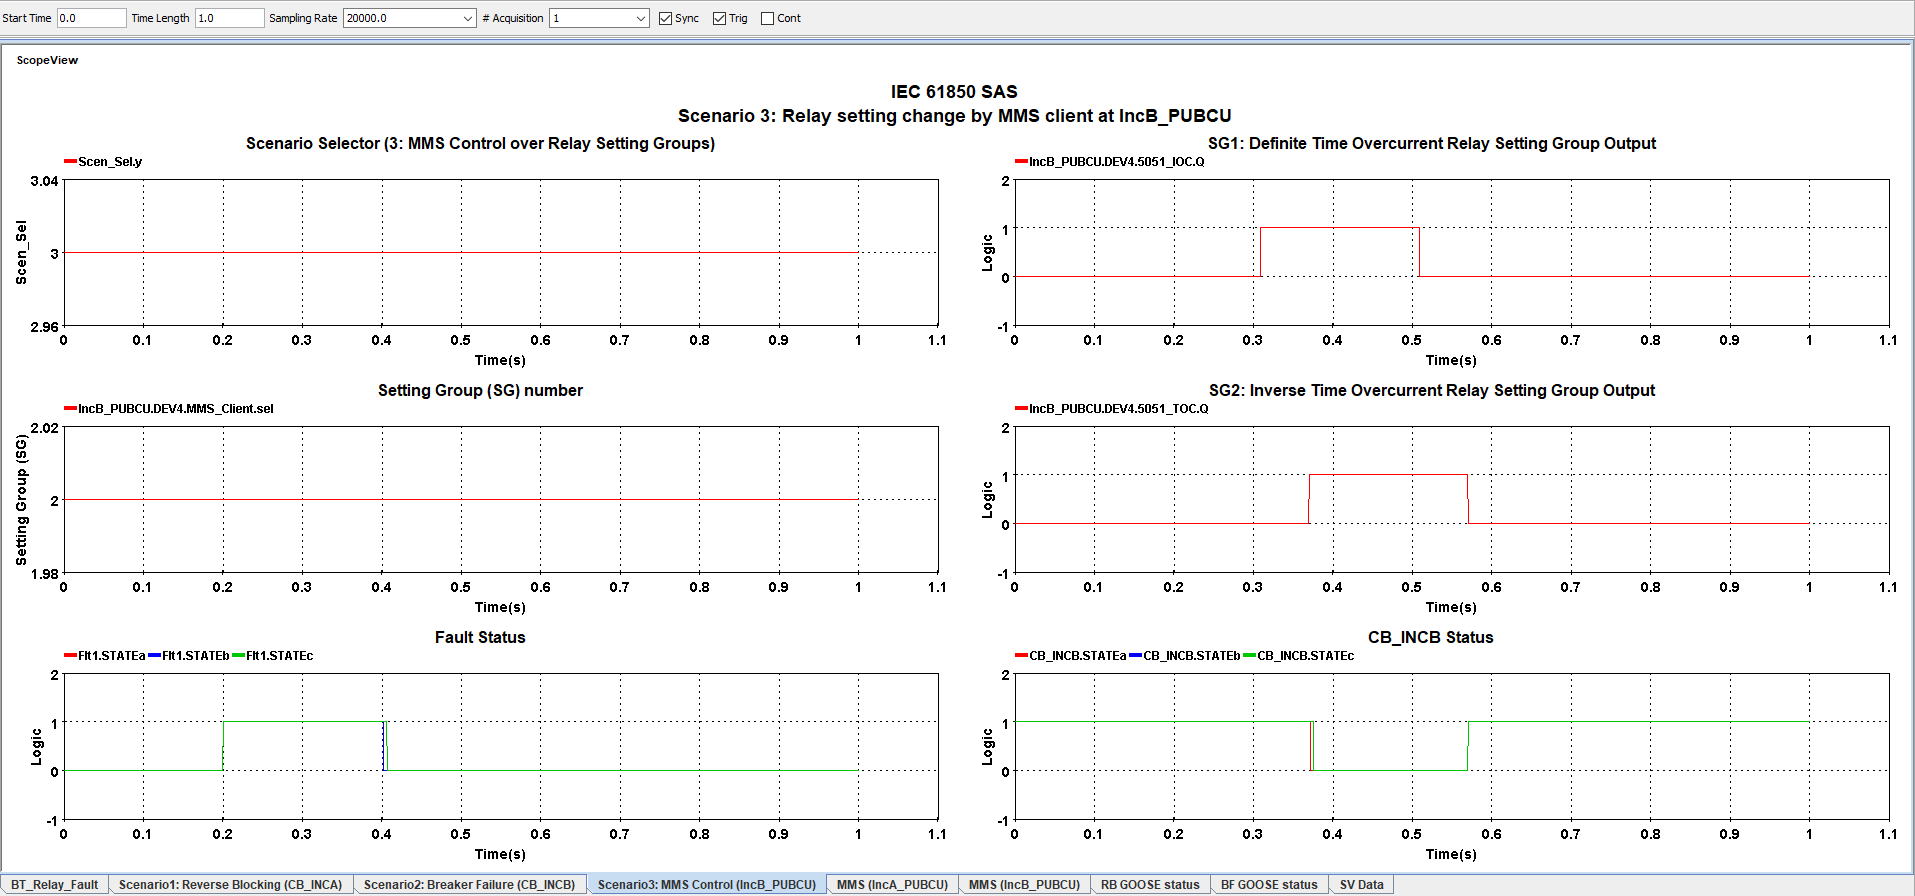
- Use an MMS client to change the setting group to 2. The picture below shows how it can be done using the free MMS client called "IED Explorer". You can view the part Using IED Explorer from Additional Information to learn how to use IED Explorer to change Setting Groups. View the same tab.
- Once the setting group has changed by the MMS client, do an acquisition in ScopeView to see the new results.
As it can be seen, the graph SG2:Inverse Time Overcurrent shows the relay's trip signal when Setting Group 2 (SG2) is selected. The time is approximately 0.36s which corresponds to the expected time shown in IncB_PUBCU Relay Setting Groups. As seen from the graph CB_INCB Status, the breaker CB_INCB has opened at 0.36 seconds.
MMS reports and data
ScopeView
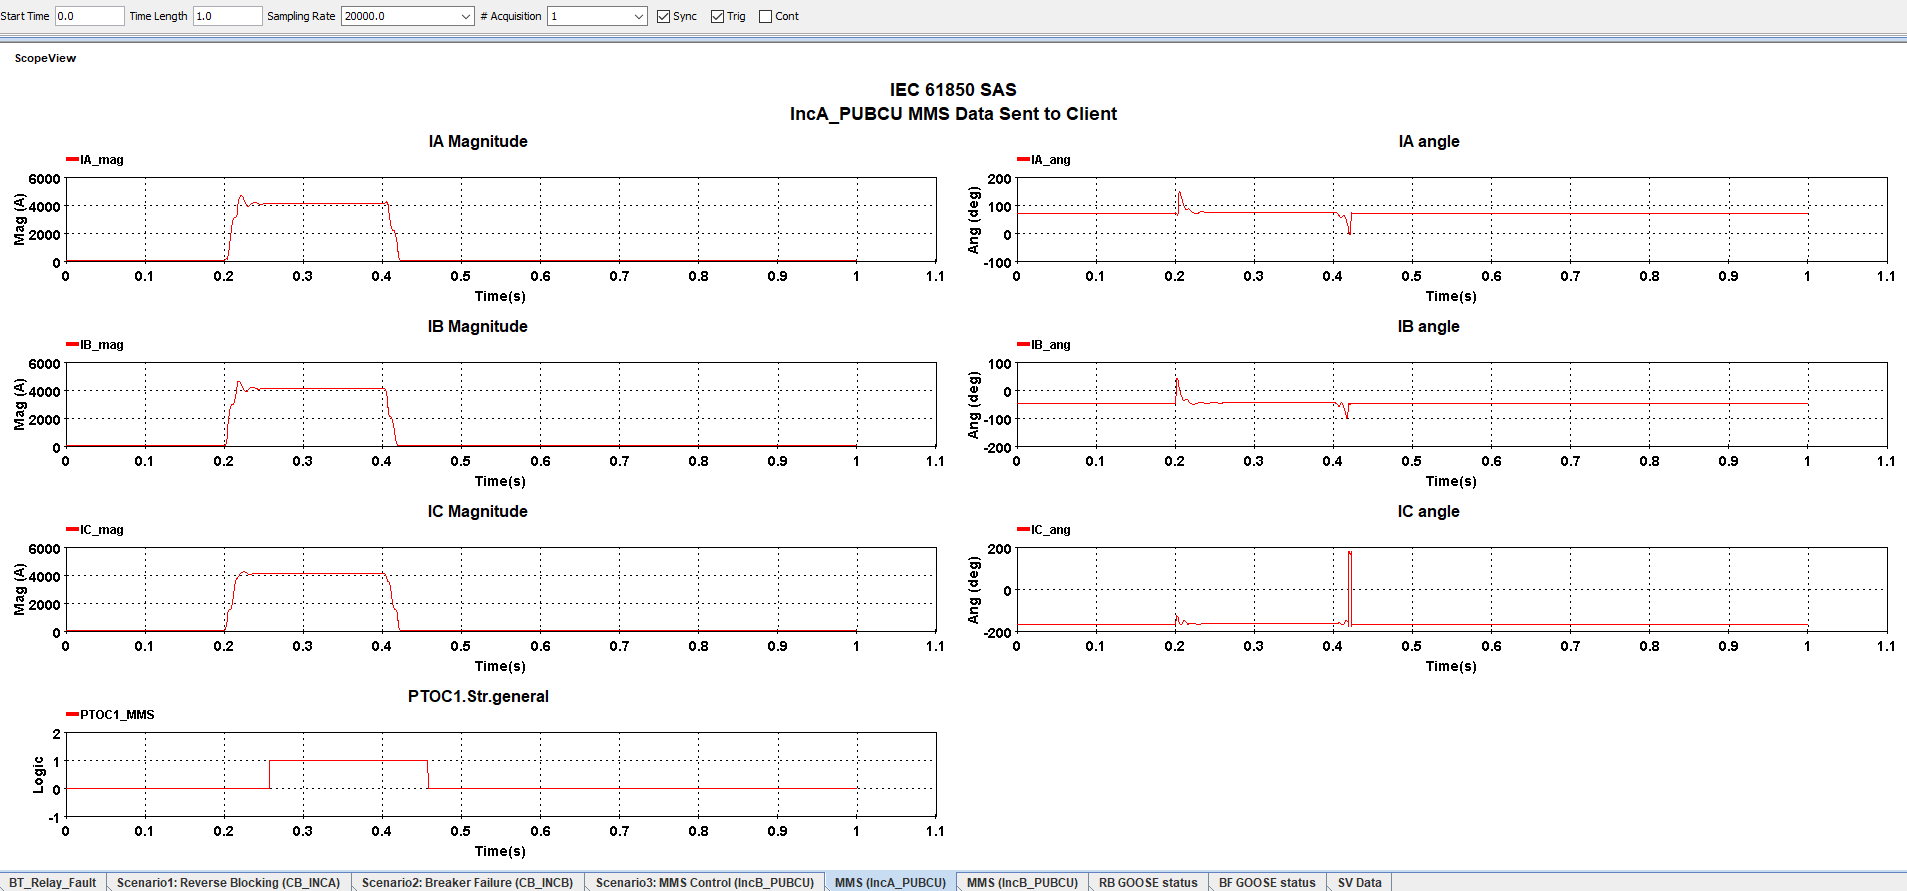
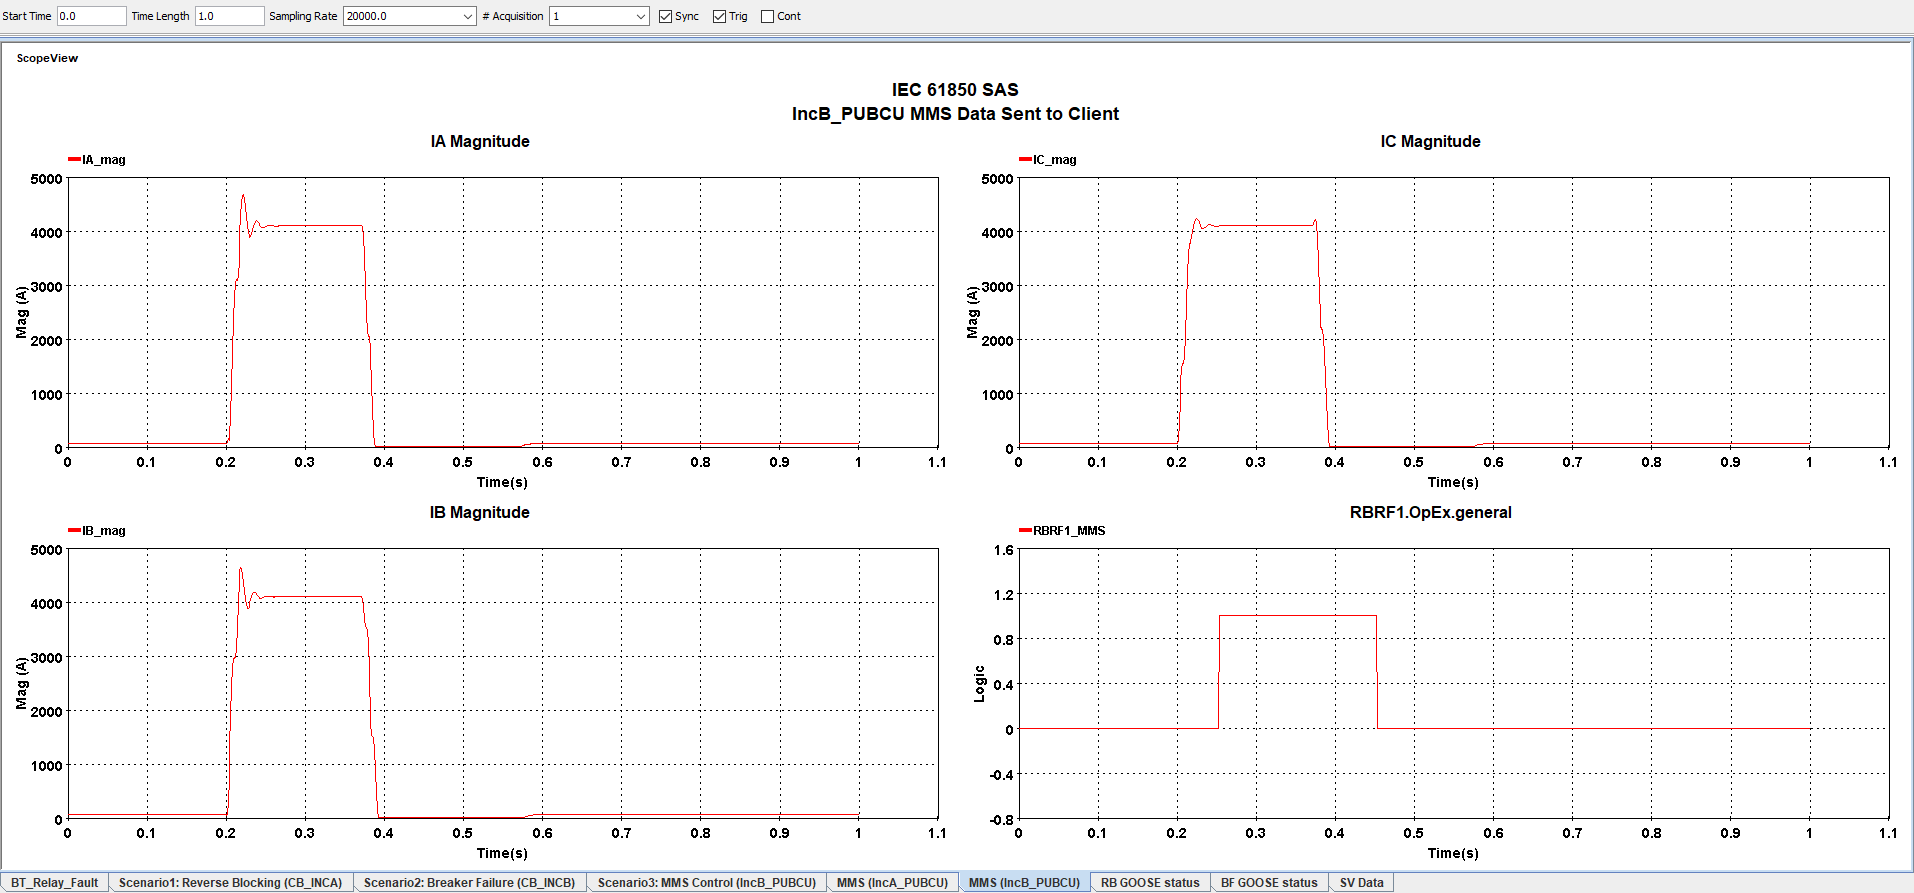
- View the diagrams in the tabs MMS(IncA_PUBCU) and MMS(IncB_PUBCU) in ScopeView. They show the data that is transmitted to the MMS client. The analog signals are current phasor magnitude and angles. The binary signals are those from logical nodes for either overcurrent protection (PTOC) or breaker failure (RBRF). Both analog and binary data are sent to the MMS client via Reports.
The following diagrams are taken during Scenario1: Reverse Blocking. The values are the same for all scenarios.
NOTE: As it can be seen from both pictures, MMS report for IncA_PUBCU contains data for phasor magnitudes and angles while reports for IncB_PUBCU only contain phasor magnitudes. This is because of the data model for each IED and depends on how they were designed.
This information can also be seen on an MMS client. On the client, the reports that are sent by the MMS servers (IEDs in the model) can be viewed, enabled and their data sets can be monitored with values changing during the simulation runtime.
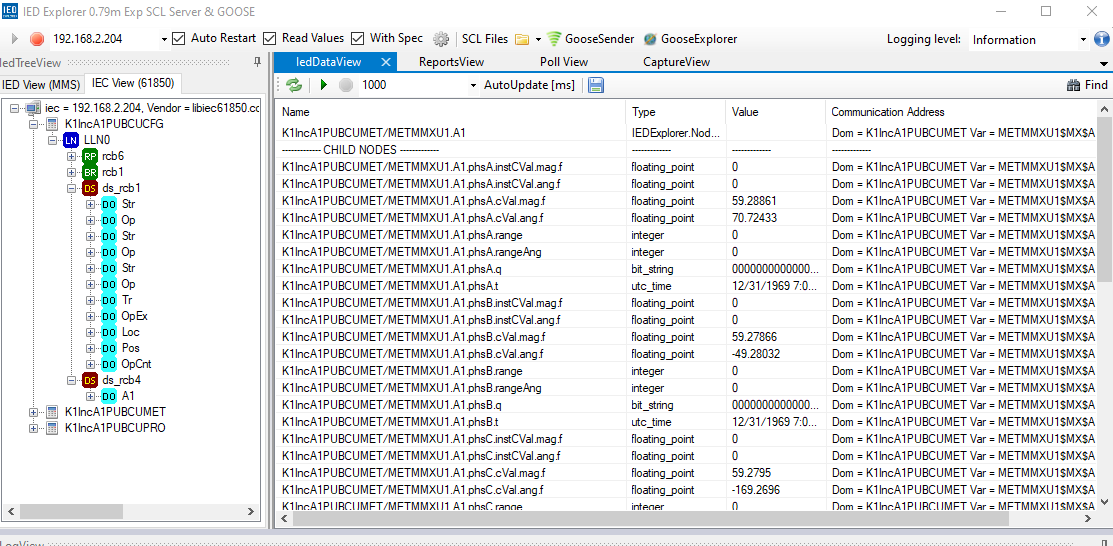
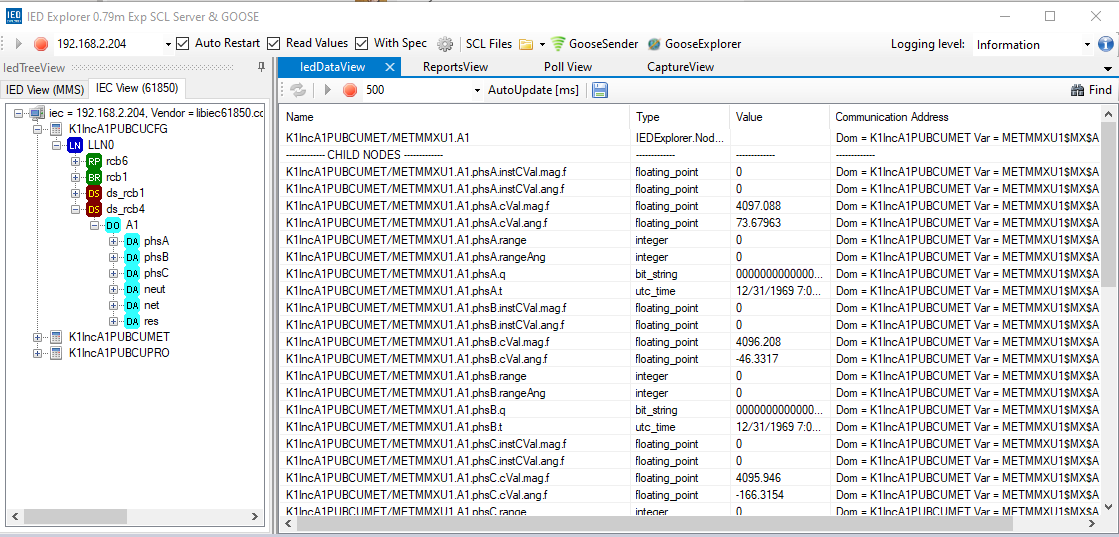
The pictures below show the report control blocks and monitored data of the measurement from IncA_PUBCU IED on the application IED Explorer. To know how to use IED Explorer to view this data, read section Show Reports and Data Sets on this documentation.
The first picture shows the IED's current phasor measurement during normal operation and the second picture shows the phasors during fault. As it can be seen, the current phasor magnitudes are very high.
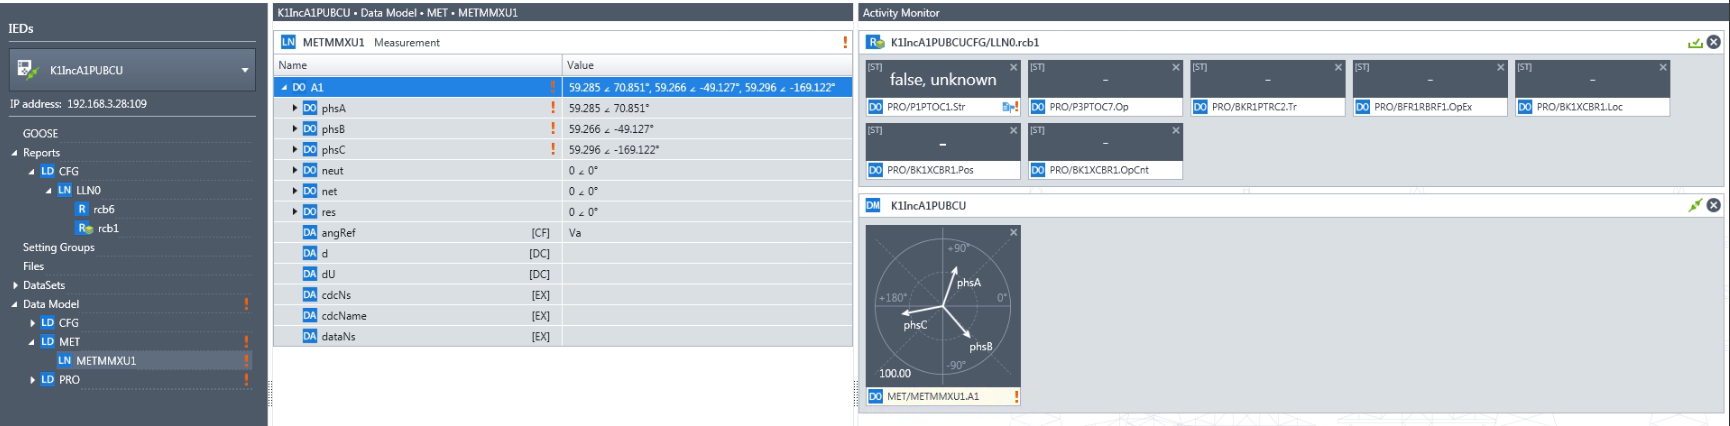
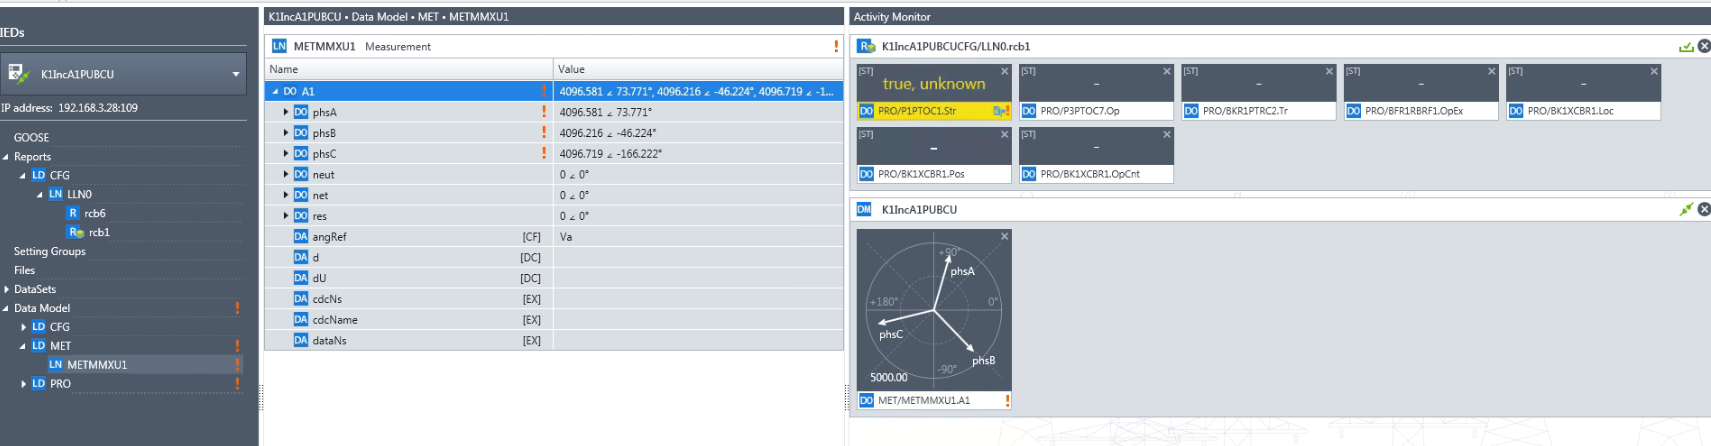
The next two pictures shows data from binary overcurrent protection signal and measurement from IncA_PUBCU IED on the application IEDScout. The first picture is normal operation and the second one is from the exact moment the fault occurred, As it can be seen, the current magnitudes are very high.
GOOSE and SV additional data
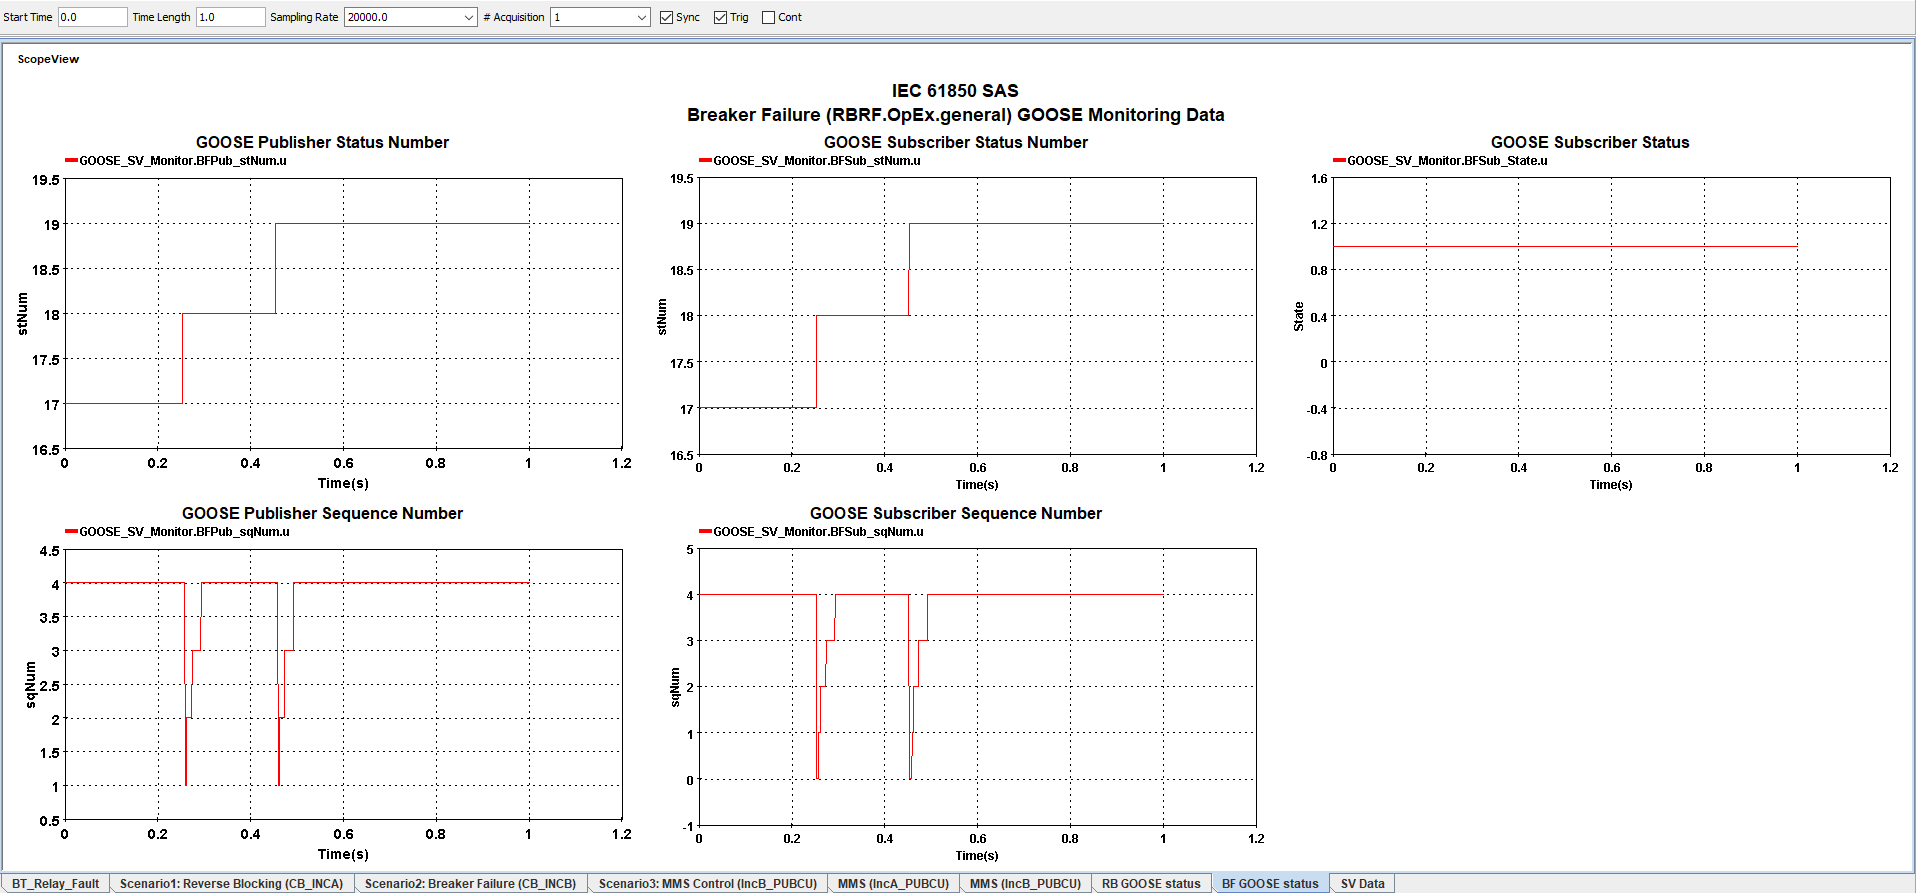
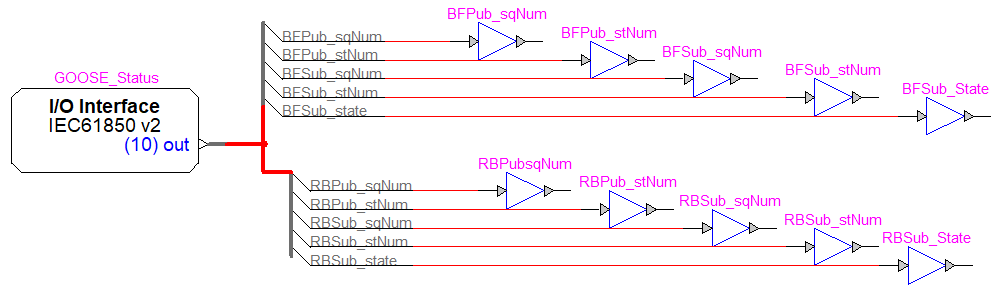
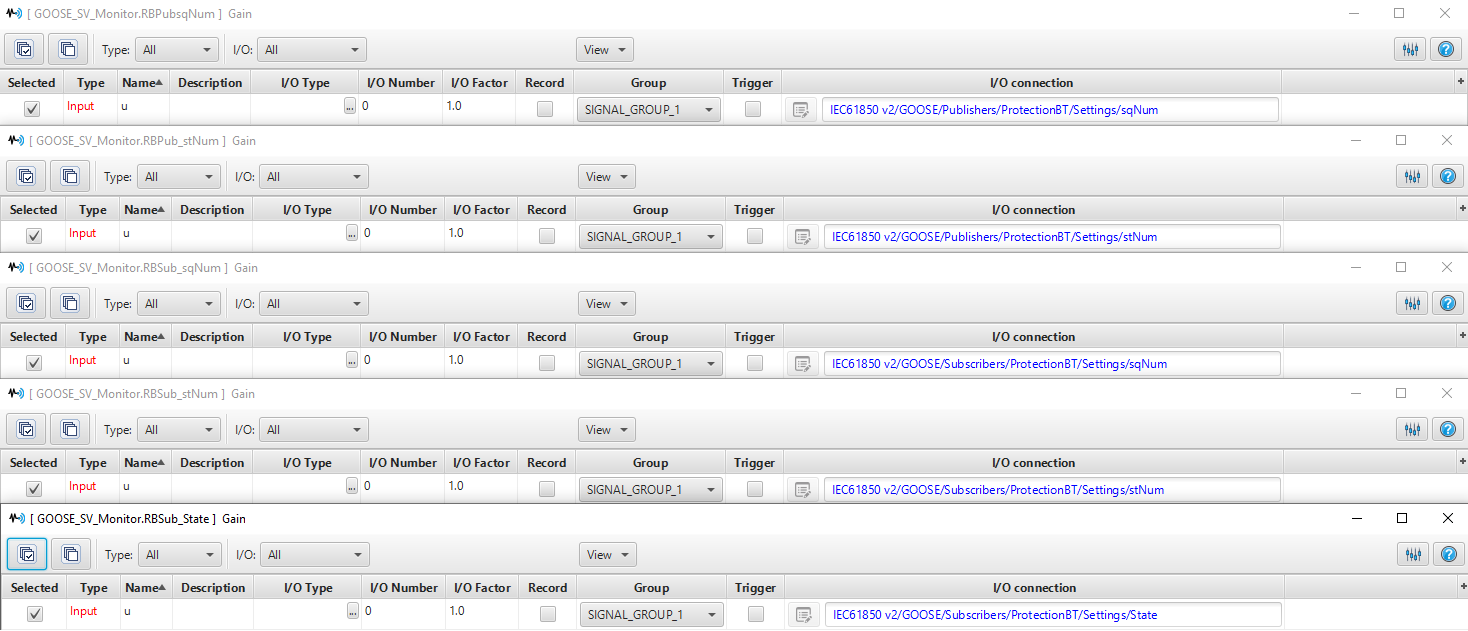
- View the pages "BF GOOSE data", "RB GOOSE data" to find data such as status number and sequence number for GOOSE publisher and subscriber of the two Reverse Blocking and Breaker Failure applications.
- stNum (Status Number) for publisher and subscriber: This data attribute increments whenever the status of the GOOSE message changes. So, in the case of the protection functions in this model, whenever the output of the relay BT_PU.5051OC (Q) changes its status, this number increments by 1. If a connection between publisher and subscriber is maintained, stNum for both publisher and subscriber should be the same value.
- sqNum (Sequence Number) for publisher and subscriber: This data attribute increments whenever the GOOSE message is retransmitted which differs for each GOOSE control block. It rests to 0 or 1 (depending on the GOOSE control block parameters). So, in this model, whenever the fault is reinitialized and the relay output changes its status, sqNum resets to 0. sqNum should be the same for both publisher and subscriber as long as their connection is established and maintained.
- State for subscriber: This data attribute has the value of 1 when the connection between publisher and subscriber is established. If they lose connection, the value drops to 0. If subscriber falls out of sync with the publisher (so it is not following it anymore). the value changes to -5.
As shown in the picture, the values for stNum, sqNum for both publisher and subscriber are the same. As it is explained, stNum increments every time there is a change in data which in this case, is when fault occurs and is cleared by doing the acquisition in ScopeView. Also, sqNum shows it drops to zero every time fault occurs or clears by pressing the acquisition. It increments again constantly until the acquisition is pressed again. State = 1 so a connection has been successfully established between GOOSE publisher and subscriber.
NOTE: The values shown in the diagram for both stNum and sqNum could be different on your ScopeView since it depends on what values they had and how long the simulation was running before the acquisition.

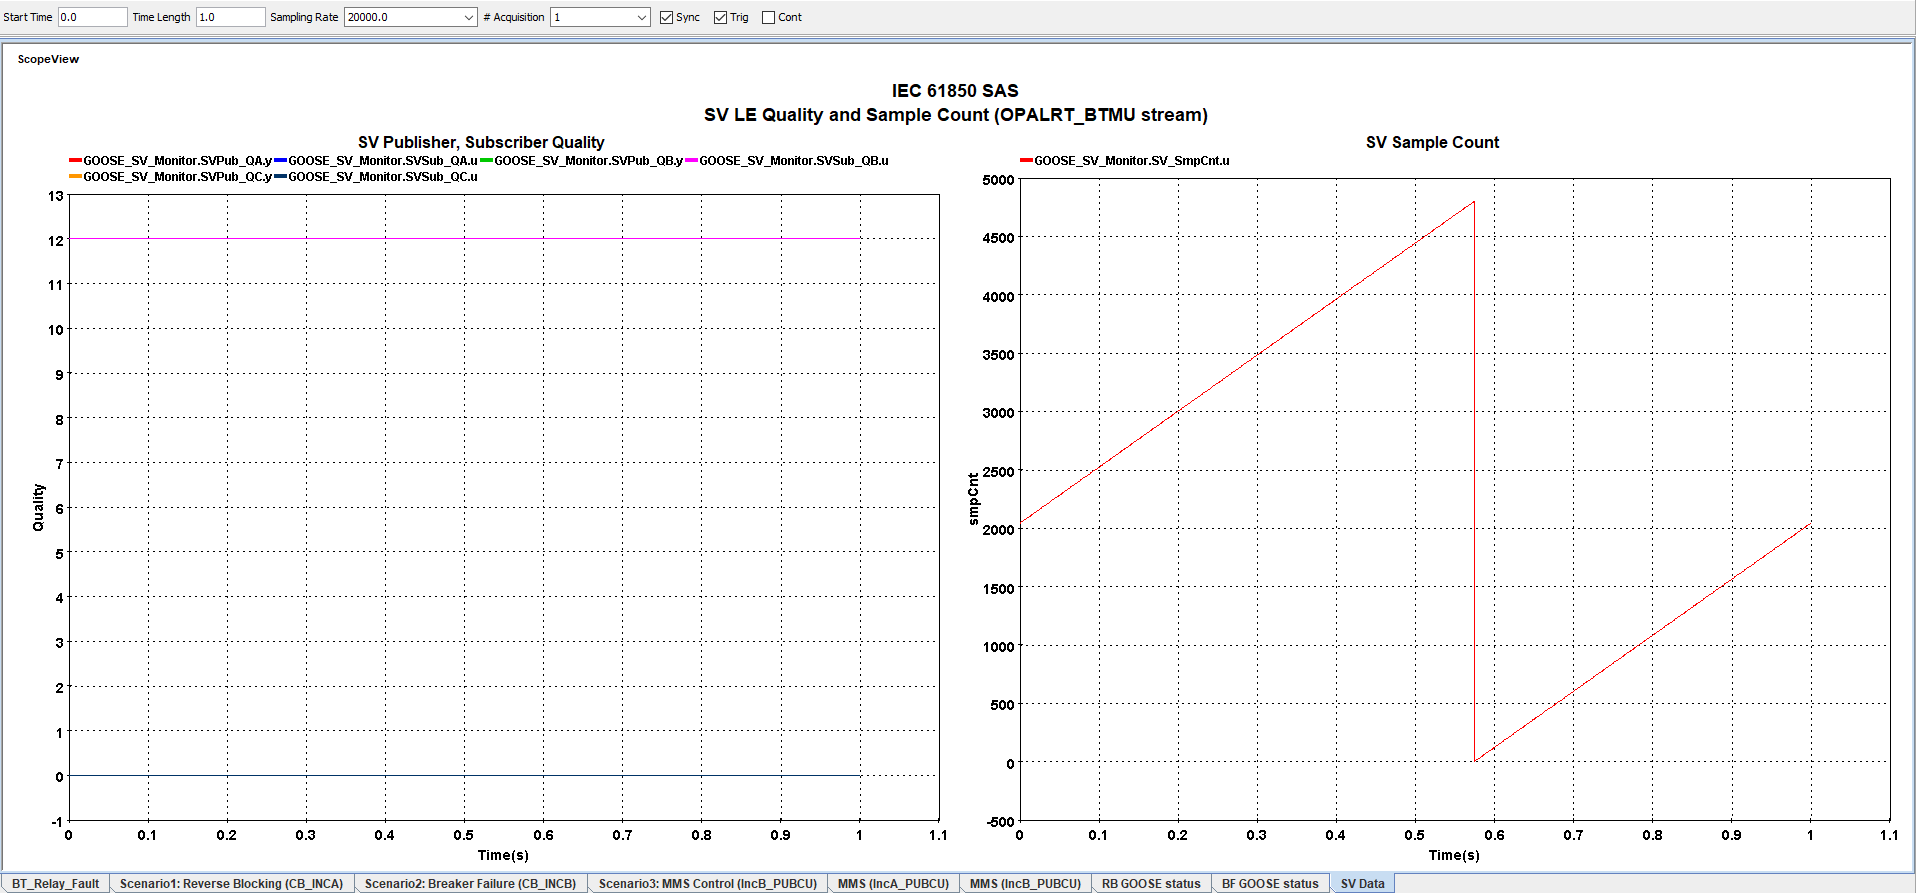
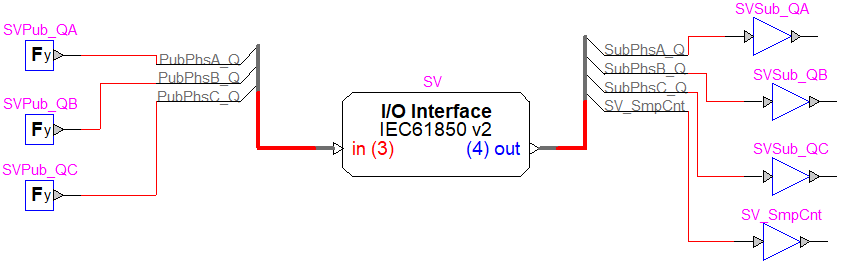
- Open the tab SV Data to view Sampled Value streams quality and the Sample Value count of the OPALRT_BTMU stream.
The SV Publisher and Subscriber Quality waveforms are taken from the constant blocks SVPub_Q which are publishing the quality value for current SV streams. If the subscriber values are the same as the publisher values, as shown in the figure, it means the connection between the publisher and subscriber is valid.
SV Sample Count shows the smpCnt value of the SV stream. This data attribute is typically used for synchronization validation. According to the standard, an IEC 61850-9-2 LE compliant merging unit can publish analog data at a fixed rate which is 80 samples per power cycle. The number of samples per second is 4800 for a 60 Hz system (like this model) and 4000 for a 50 Hz system. The figure shows how smpCnt reaches 4800 in one second.
Additional Information
Substation Origins
This section shows the design reference for this model.
The model is based on the substation designed by the IEC 61850 User Group under the UCA International User Group (UCAIUG) during the IOP conferences of 2017 and 2019 [1]. The substation design by IOP can be found here: https://iec61850.ucaiug.org/2021-22_IOP/IOP%20Materials/IntegratedApplicationDesignV1c.pdfThe single line diagram of the model can be seen in the figure below.
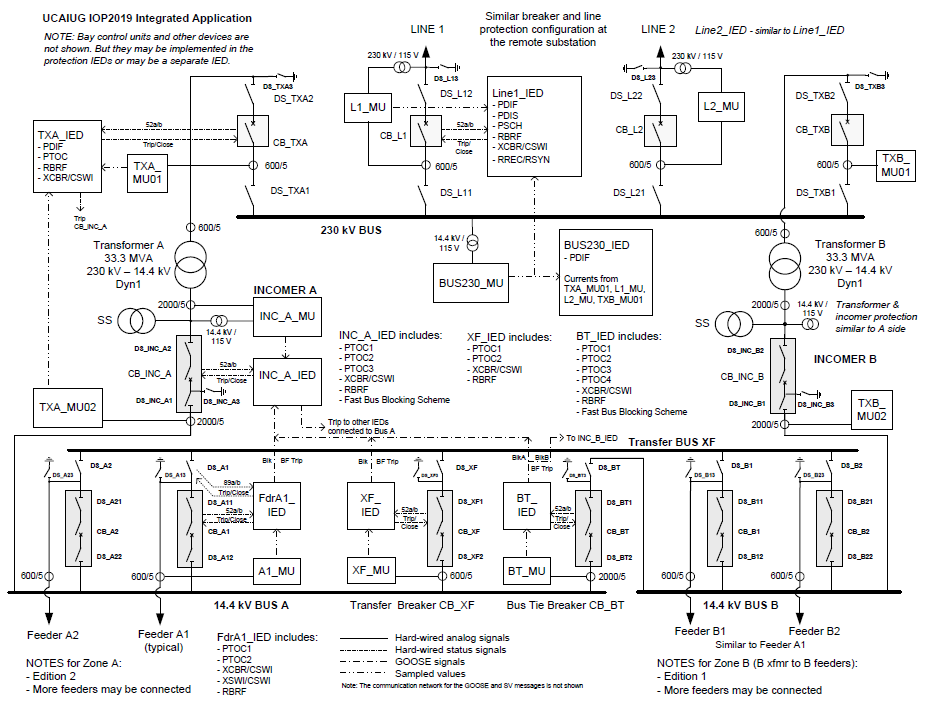
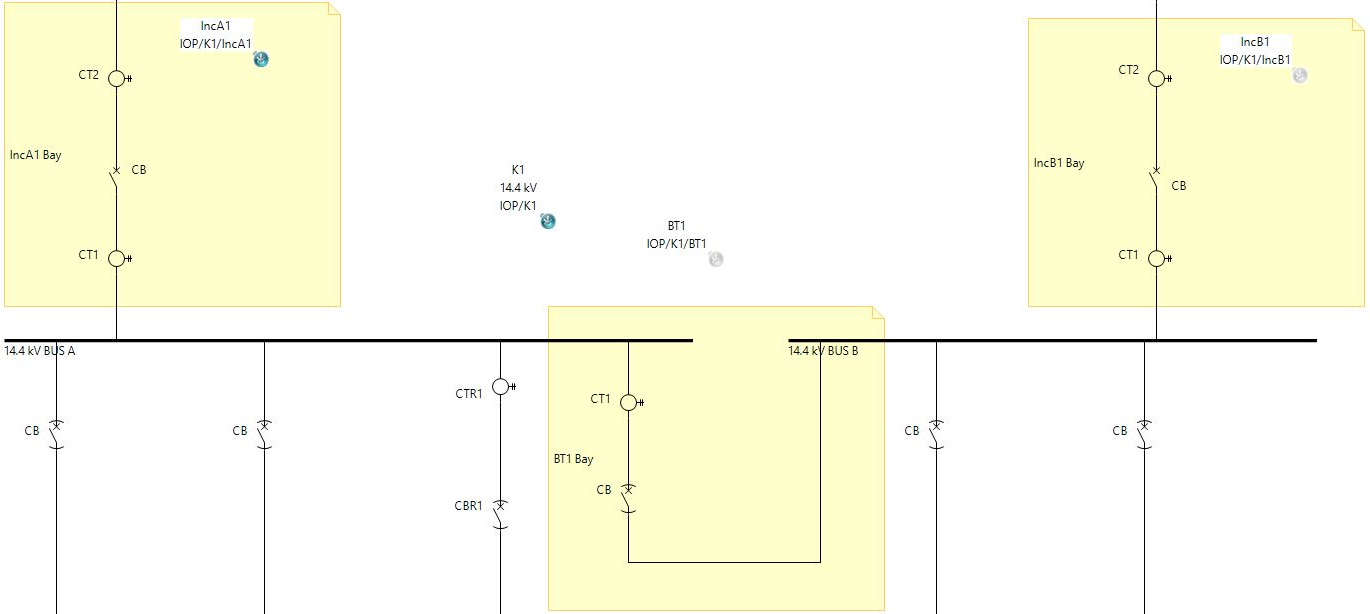
Helinks STS, a vendor-independent system configuration tool, was used to design the SAS based on the IOP substation [2]. The design focuses on three bays at the 14.4 kV voltage level: IncA, IncB, BT. The result of the SAS design in Helinks STS is an SCD file which contains all information from the substation including communication.
The picture below shows the design of the three bays in Helinks STS.
The following picture shows a part of the SCD file, specifically the GOOSE communication section.
GOOSE, MMS, and SV Sensor Mapping
Mapping the sensors of devices in the HYPERSIM model to the IEC 61850 data has been primarily done using the I/O Interface block. The mapping information is shown in this section for each bay.
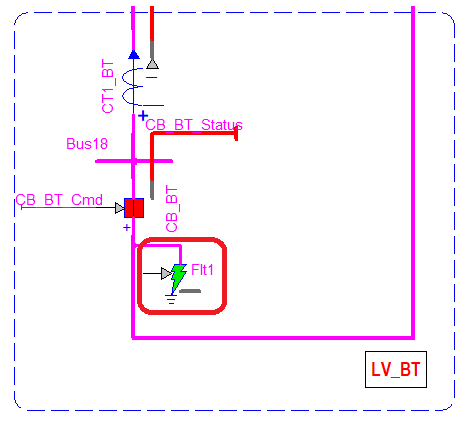
BT
CT1_BT
BT_PU IED
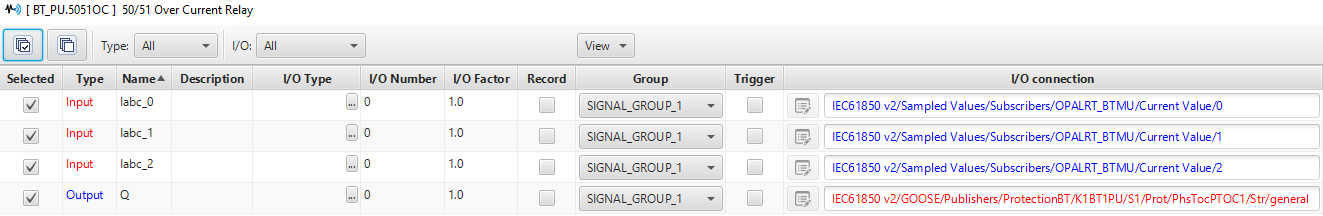
5051OC Relay for SV Current subscription and PTOC.Str.general publishing
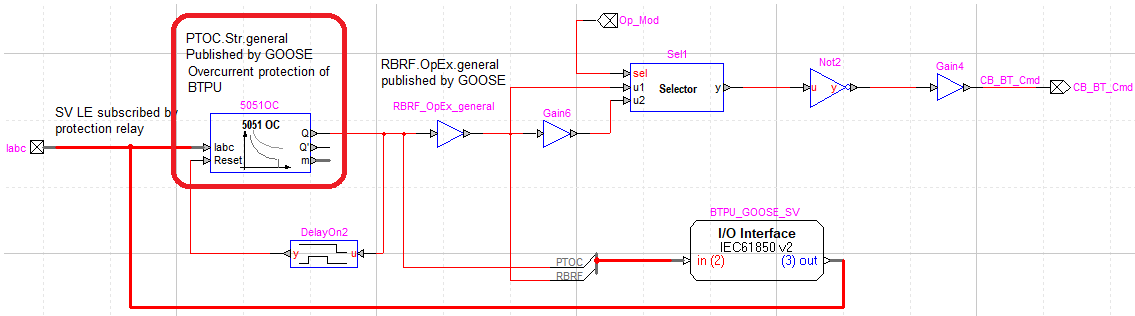
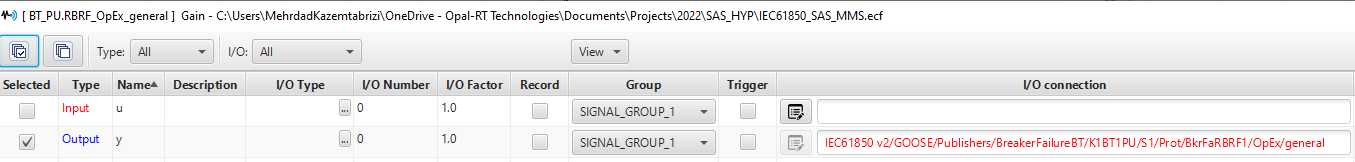
Gain "RBRF_OpEx_general" (its output) for RBRF.OpEx.general publishing
IncA
CT1_INCA
IncB_PUBCU
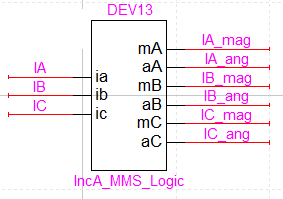
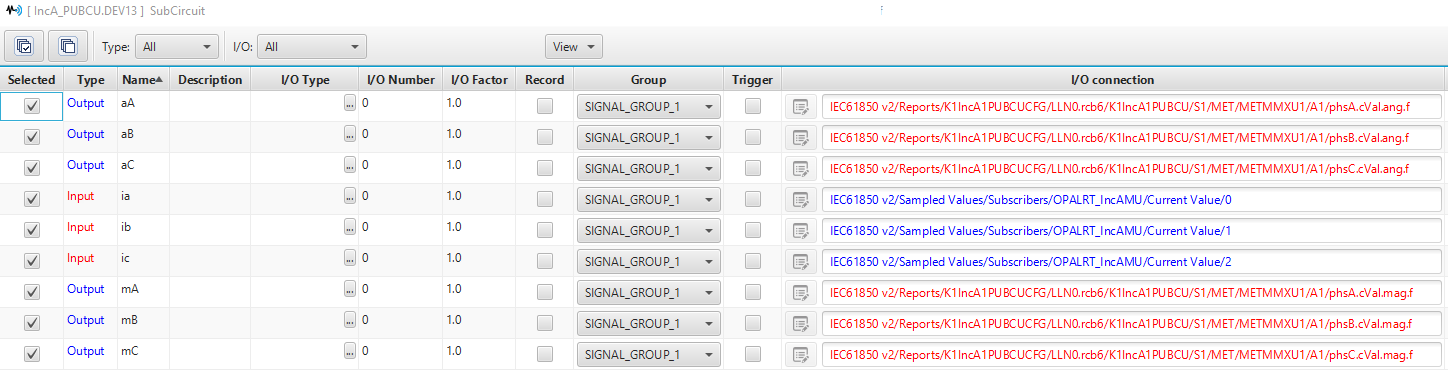
SV Subscription and MMS transmission of magnitude and angle of current phasors in the subcircuit IncA_MMS_Logic
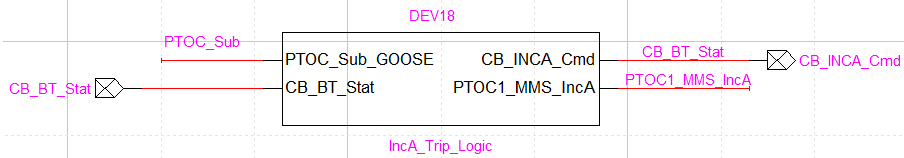
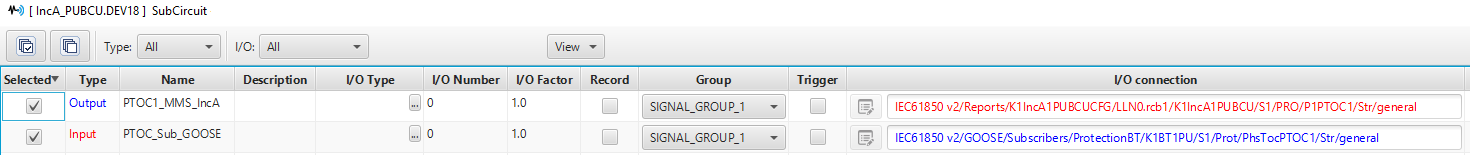
PTOC.Str.general GOOSE subscription and MMS transmission of PTOC signal in subcircuit IncA_Trip_Logic
IncB
CT1_INCB
Incb_PUBCU
SV subscription on gains
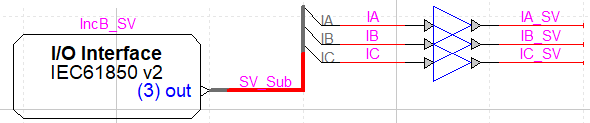
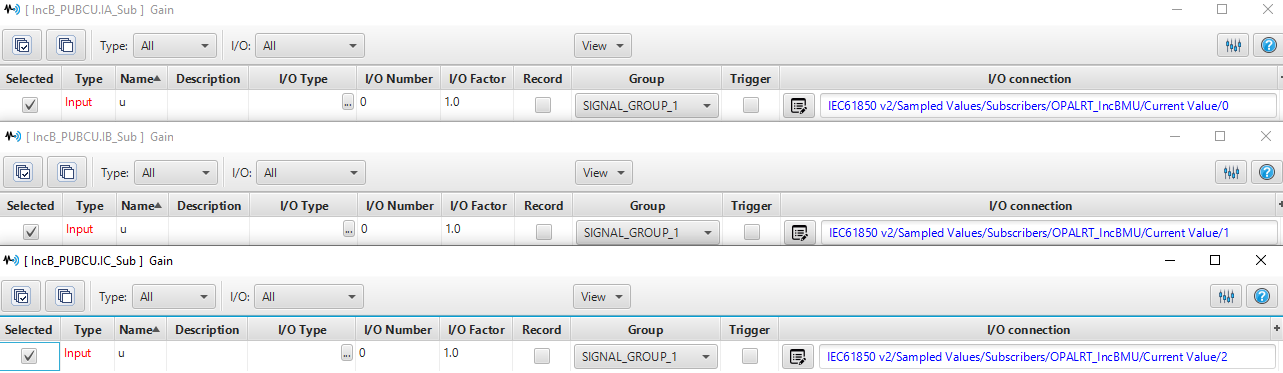
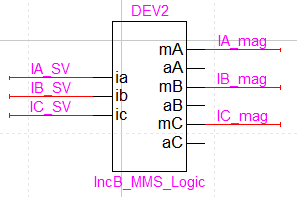
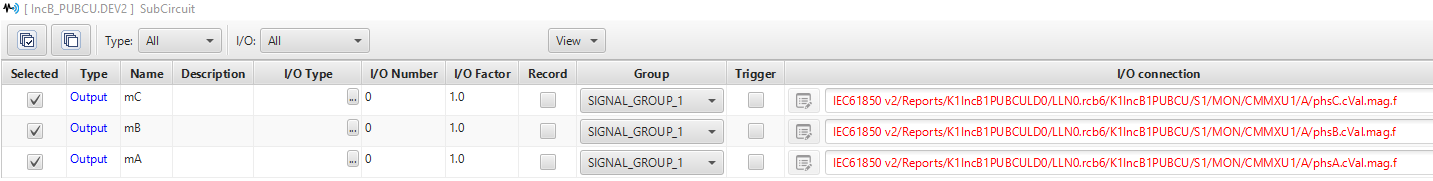
MMS transmission of magnitude of current phasors in the subcircuit IncB_MMD_Logic
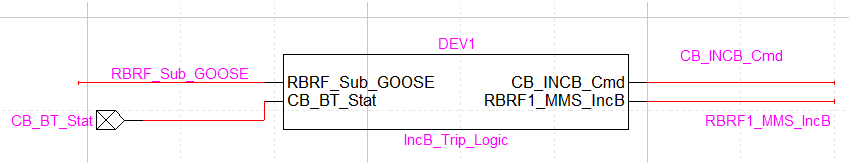
GOOSE subscription to RBRF.OpEx.general from BT_PU and MMS transmission of RBRF.OpEx.general in the subcircuit IncB_Trip_Logic
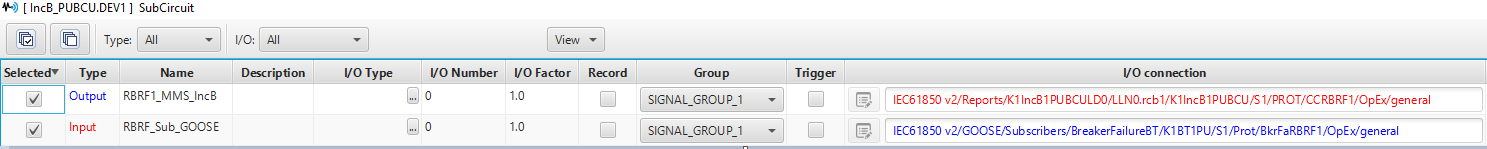
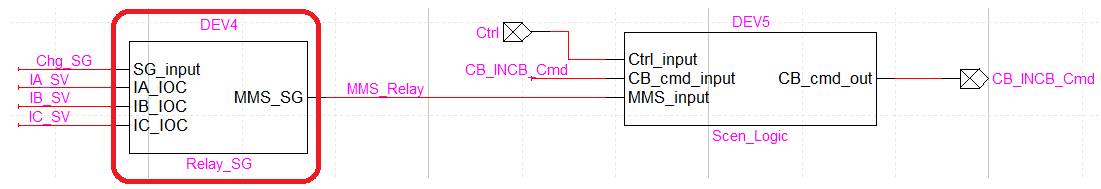
MMS reception of PTOC.SE.StrVal data which is used to change setting groups in Subcircuit Relay_SG

GOOSE and SV Monitoring Data
GOOSE monitoring data for Breaker Failure and Reverse Blocking Applications
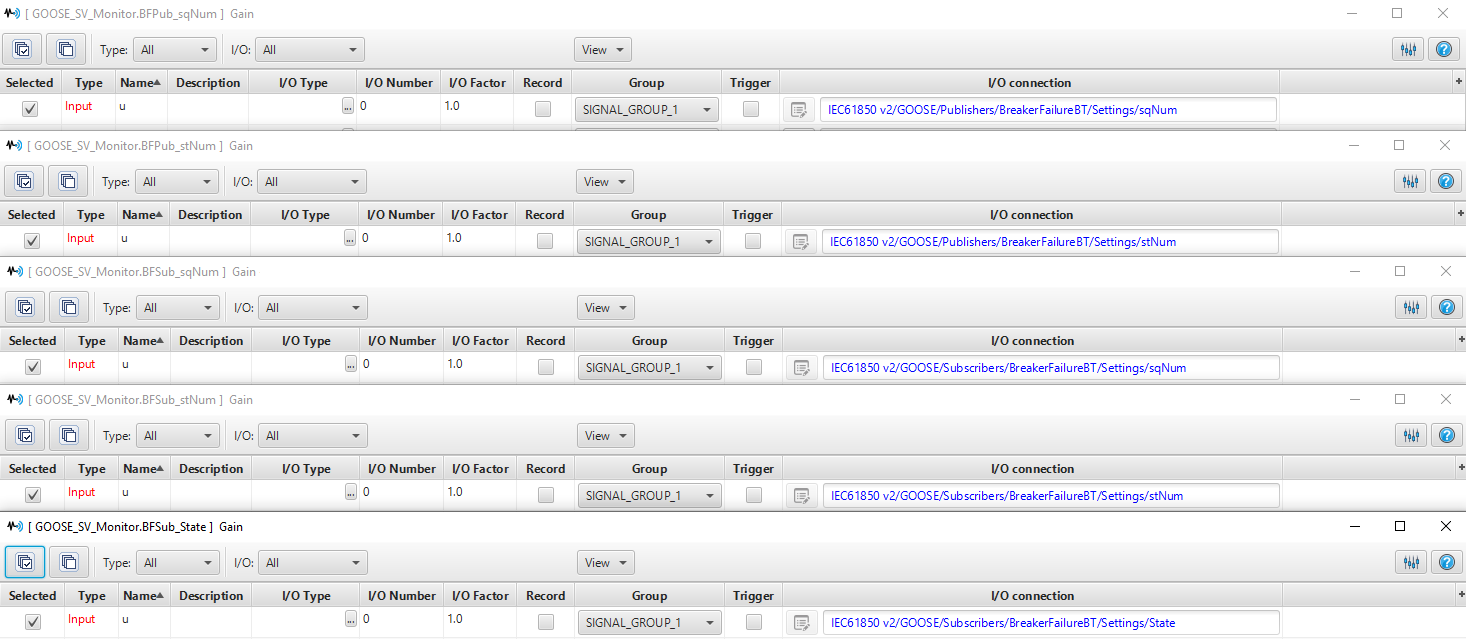
Gains for Pub_BF, Sub_BF for stNum, sqNum, State
Breaker Failure (BF)
Reverse Blocking (RB)
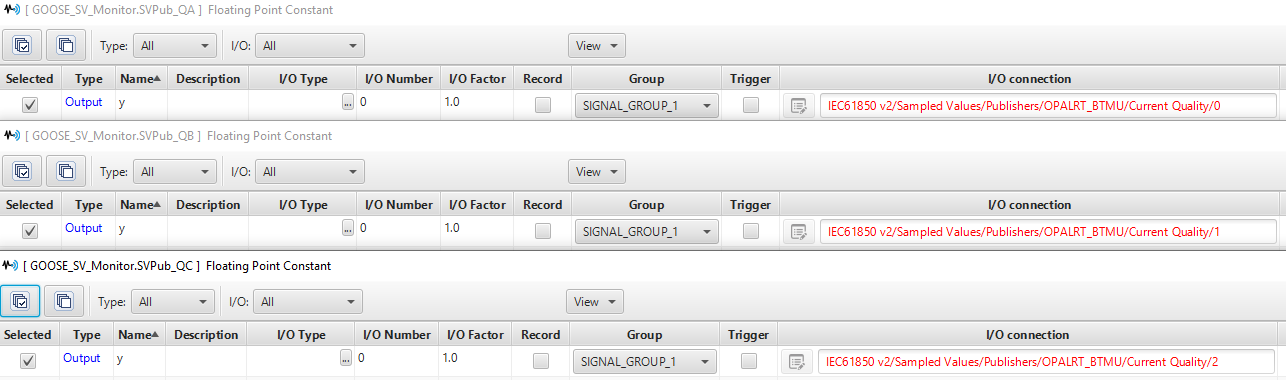
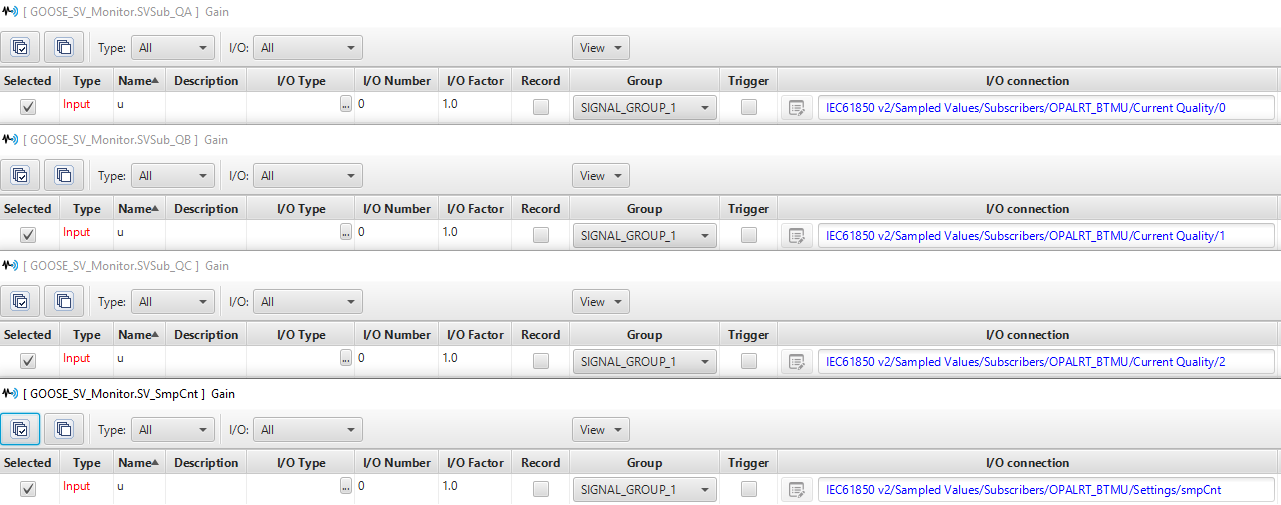
Constants for SV quality publishing and Gains for SV quality subscription and Sample Count
SV Quality publishing
SV Quality subscription and Sample Count
Using IED Explorer
The free IEC 61850 tool IED Explorer is used as an MMS client. This section shows how to use it.
Change Setting Groups
The first thing to do is to make sure the data that is transmitted via the MMS Client/Server communication is shown in the tool. This is related to the section Scenario3: MMS Control.
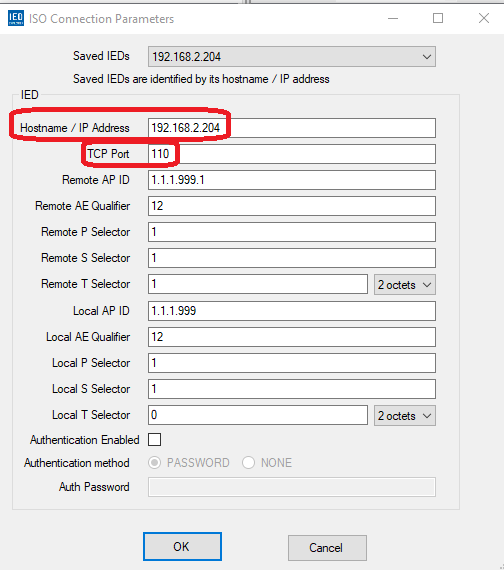
Press the setting option, a window opens which lets the user set up the connection parameters to the server.

The next picture shows the server parameters. The IP address is for the simulator that is used for this example model. The TCP Port is the one used for IncB_PUBCU which was shown in the section IEC 61850 I/O Interface on this page MMS Servers. After the simulator and IED is setup, press OK to save this information.
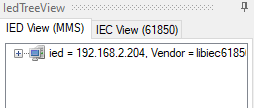
The simulator can be selected from the drop down menu and by pressing Play, in the IED View (MMS), you should be able to see the name of the simulator appear.

Expand the IED with simulator IP address to view the IED data model. You need to find the following information: K1IncB1PUBCUOC4_1. This is the logical device that has data which is used in the model. It is the same one as shown in the IEC 61850 I/O interface page, in the data model of the IED: IncBPUBCU Data Model.
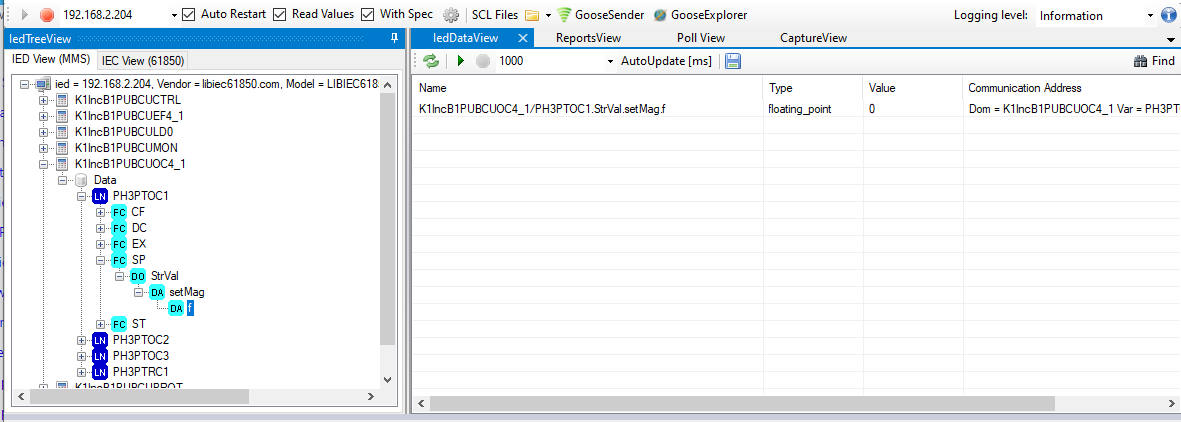
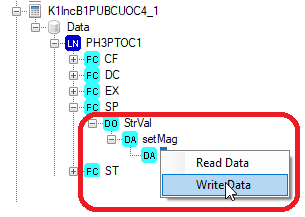
As it can be seen, the value of this data attribute is 0. Use the right mouse click on "f" on the left side of the screen after you have expanded the IED data model. Choose Write Data.
Highlight the field "New Value" on the next screen and type 1 or 2.
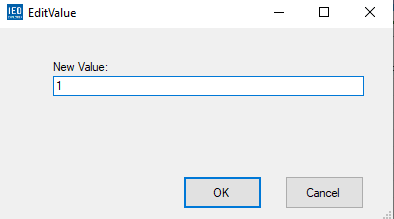
If you press OK, the setting groups will be changed between 1 and 2.
You can use other values here too but the model will consider 1 or 2.
Show Reports and Data Sets
This section shows how to enable reports and view data in data sets. It is relevant to viewing MMS reports in the Simulation and Results section.
First, establish a connection to the IED using the TCP Port and simulator address. You can find the TCP Port for each IED from MMS Servers.
For this example, the information for IncAPUBCU is used. It has the TCP port of 109. So, click on the setting option, keep the IP address of the simulator the same value and change TCP port to 109. You might need to press play again for the tool to find the reports from this IED.
Once the communication is established and IED Explorer is showing the data model and information for the IED, click on IEC View (61850) in the IedTreeView panel and expand the K1IncA1PUBCUCFG. You need to expand one of these logical nodes to find the Logical Node LLN0 and the subsequent rcb.
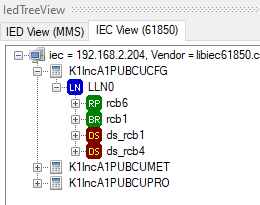
Expand on ds_rcb4 to view the measurements from bay INCA. Expand until you reach phsA and click on it to show its values on the right side of the page under the IedDataView.
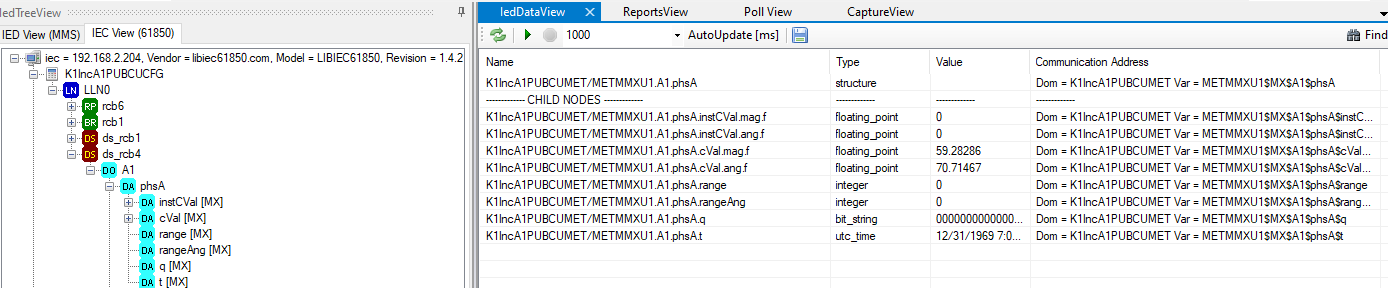
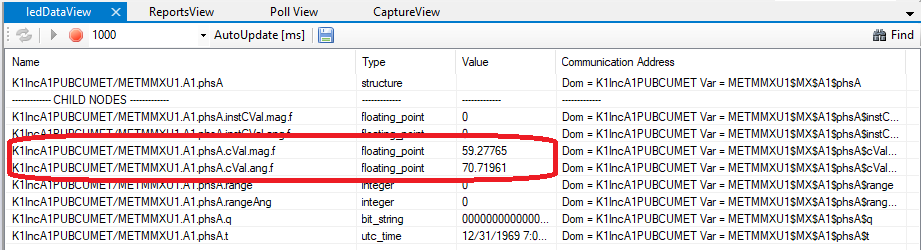
Press play in the IedDataView page to see the values for both magnitude and phase of the current phase A be updated automatically as the simulation is running. Once you do an acquisition on ScopeView, you might be able to catch the high current value in IED Explorer too. But that depends on whether data in IED Explorer is updated fast enough to catch the quick fluctuations of the current.
References
OPAL-RT TECHNOLOGIES, Inc. | 1751, rue Richardson, bureau 1060 | Montréal, Québec Canada H3K 1G6 | opal-rt.com | +1 514-935-2323
Follow OPAL-RT: LinkedIn | Facebook | YouTube | X/Twitter