Documentation Home Page ◇ HYPERSIM Home Page
Pour la documentation en FRANÇAIS, utilisez l'outil de traduction de votre navigateur Chrome, Edge ou Safari. Voir un exemple.
Examples | GHOST Microgrid Model
- Sylvain Ménard
Location
This example model can be found in the software under Distribution and Industrial Power Systems > GHOST_Microgrid.ecf".
Description
The GHOST model is based on the Banshee distribution network model developed by NREL and Massachusetts Institute of Technology Lincoln Laboratory during the Microgrid & DER Controller Symposium held in February 2017 [1] [2]. The GHOST microgrid is a distribution level power system model that features Diesel Generators (DG), Solar Photovoltaic generation system (PV), Battery Energy Storage Systems (BESS), along with short distribution lines. The main objective of this example is to showcase the implementation of a network with multi-feeder microgrids and the power management with multiple Distributed Energy Resources (DER).
Note that protection systems are not modeled in this version of the model and would be added in the future. A simple microgrid power management control is also featured which demonstrates the working of various DERs under the grid-connected and respective islanded modes of operation. The featured microgrid controller can be completely or partially replaced by user-designed controllers for HIL studies. The model time step is: 100us
Network Description
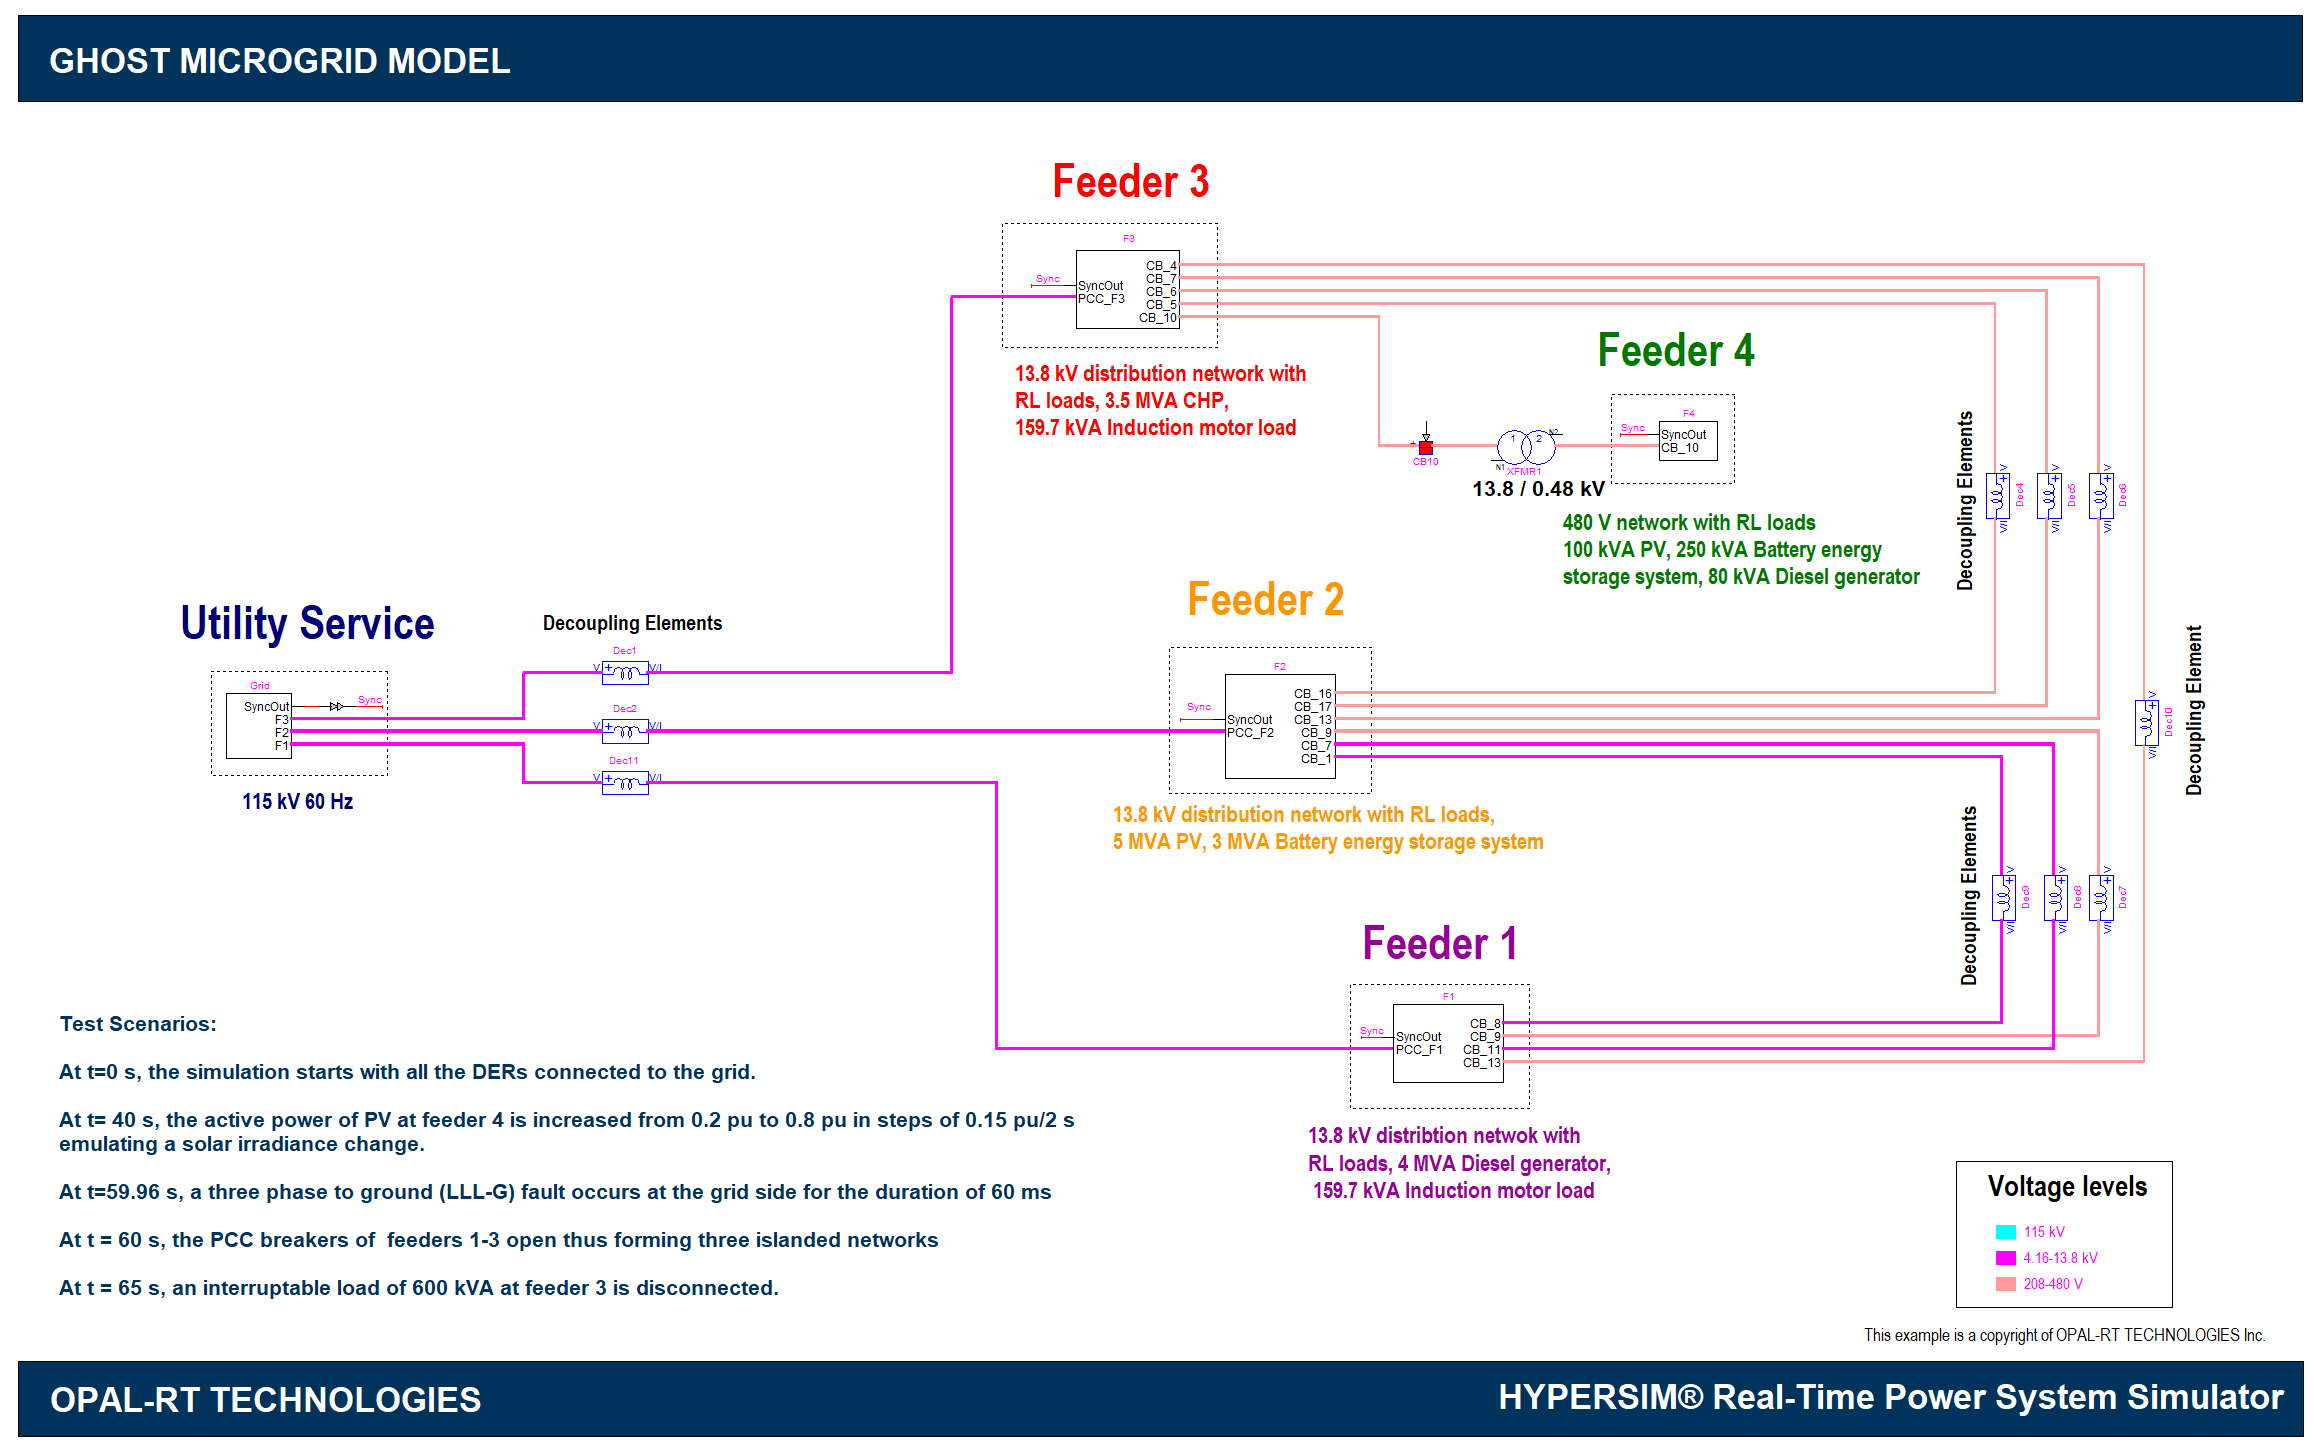
The figure below shows the single line diagram of the GHOST network [1]:
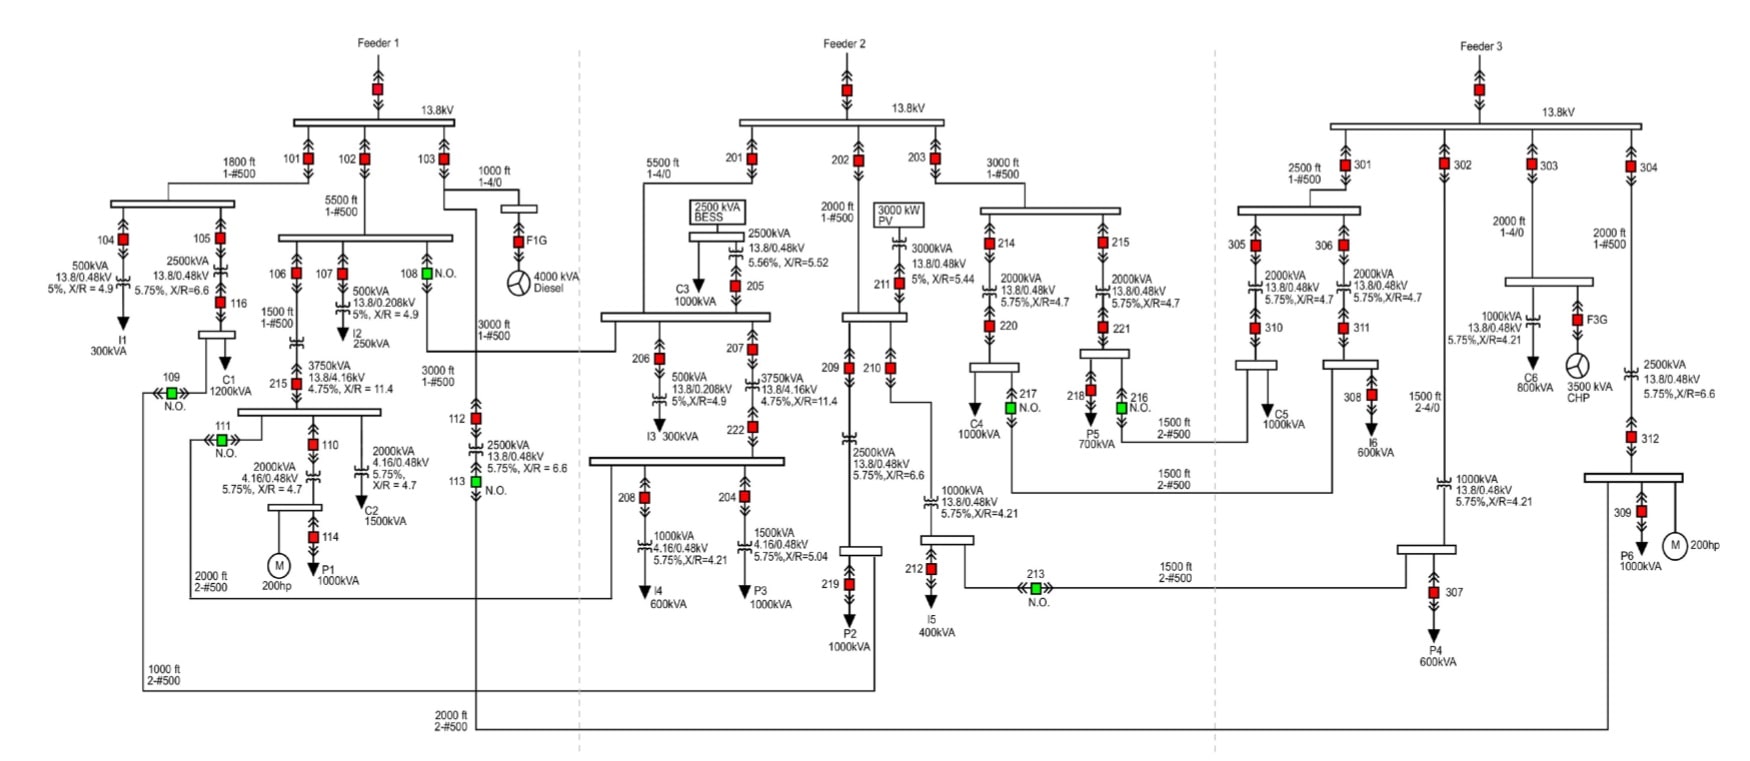
The model consists of three main feeders (Feeder 1-3) supplying electric power to distributed loads. The utility grid of the model is rated at 115 kV and is connected to the rest of the network operating at multiple medium and low voltage levels, specifically at 13.8kV, 4.16kV, 480 V, and 208 V. The model consists of eighteen loads (modeled as RL branches) which are categorized as 6 critical, 6 priority, and 6 interruptible. Critical loads have high requirements for continuous electrical service, power quality, and reliability. Priority loads can be disconnected during contingencies or islanding to maintain power balance. Interruptible loads can be shed during the time of contingencies. In addition to these loads, there are two large induction motors of 159.7 kVA rating at Feeder 1 and Feeder 3, representing industrial setup.
The feeders 1-3 have the following DERs: A 4 MVA diesel generator and a 3.5 MVA natural gas-fired combined-heat-and-power (CHP) at Feeder 1 and 3 respectively along with their associated exciter and governor models, a 5 MVA photovoltaic (PV) generation system and a 2 MVA battery energy storage system at Feeder 2 with their respective controls.
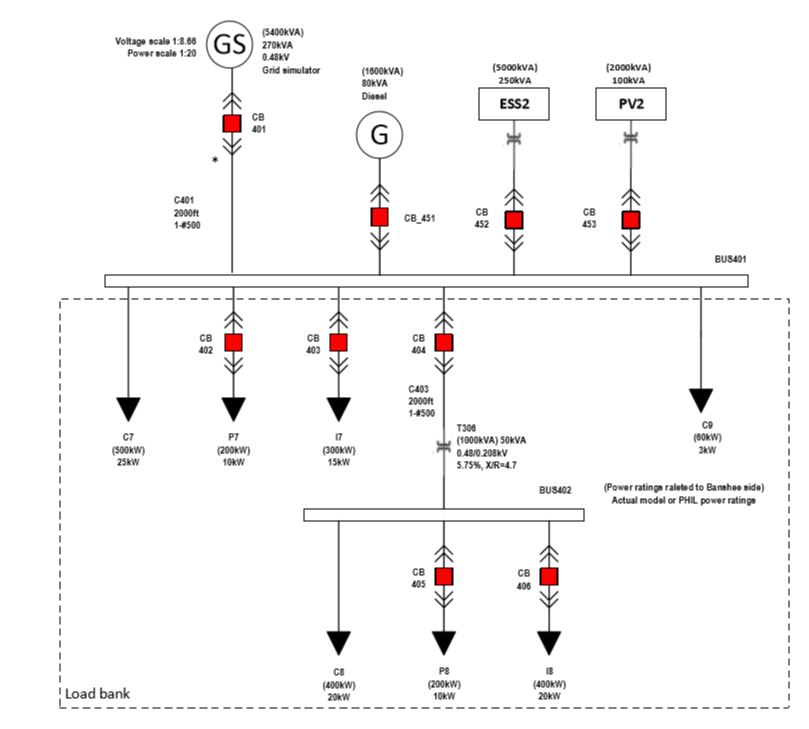
The model also consists of Feeder 4 (below), which is the representative model of an actual laboratory PHIL setup of DERs connected to the network [1]. It is to be noted that the PHIL node interface is not modeled here, and the feeder is connected to the rest of the network through a 13.8/0.48kV transformer at the end of Feeder 3. Feeder 4 consists of two busses, a 100 kVA PV system, a 250 kVA battery energy storage system, and an 80 kVA diesel generator [1].
The following table provides a summary of the DERs present in the microgrid.
DER type | Location | Power rating (kVA) | Voltage rating (kV) | Grid-forming capability |
|---|---|---|---|---|
Diesel generator | Feeder 1 | 4000 | 13.8 | Yes |
PV | Feeder 2 | 5000 | 0.48 | No |
BESS | Feeder 2 | 3000 | 0.48 | Yes |
CHP | Feeder 3 | 3500 | 13.8 | Yes |
Diesel generator | Feeder 4 | 80 | 0.48 | Yes |
PV | Feeder 4 | 100 | 0.48 | No |
BESS | Feeder 4 | 250 | 0.48 | Yes |
Simulation and Results
The complex model as described above is operated under various scenarios as described below. The sequence demonstrates the operation of different DERs under several conditions including a contingency causing the network to split into 3 islanded microgrids: Feeder 1-3.
When executing in real-time, it is recommended to put "opgcc" in Settings – Target – Compiler and Linker. The model currently works only on Redhat and OPRTLinux targets.
Test Scenarios/Sequence of Events
The following sequence of events are applied by loading "GHOST_Microgrid.svt" in ScopeView and starting a data acquisition with Sync and Trigger options checked:
The simulation starts with all the DERs connected to the grid. The active and reactive power setpoints of the DERs connected at different feeders are tabulated as below:
Power References of DERs at Start of SimulationFeeder
Type of DER
Active Power (pu)
Reactive Power (pu)
Feeder 1
DG
0.8
0.5
Feeder 2
BESS
0.8
0.2
PV
1
0
Feeder 3
CHP
0.8
0.4
Feeder 4
BESS
0.8
0.1
DG
0.6
0.1
PV
0.6
0
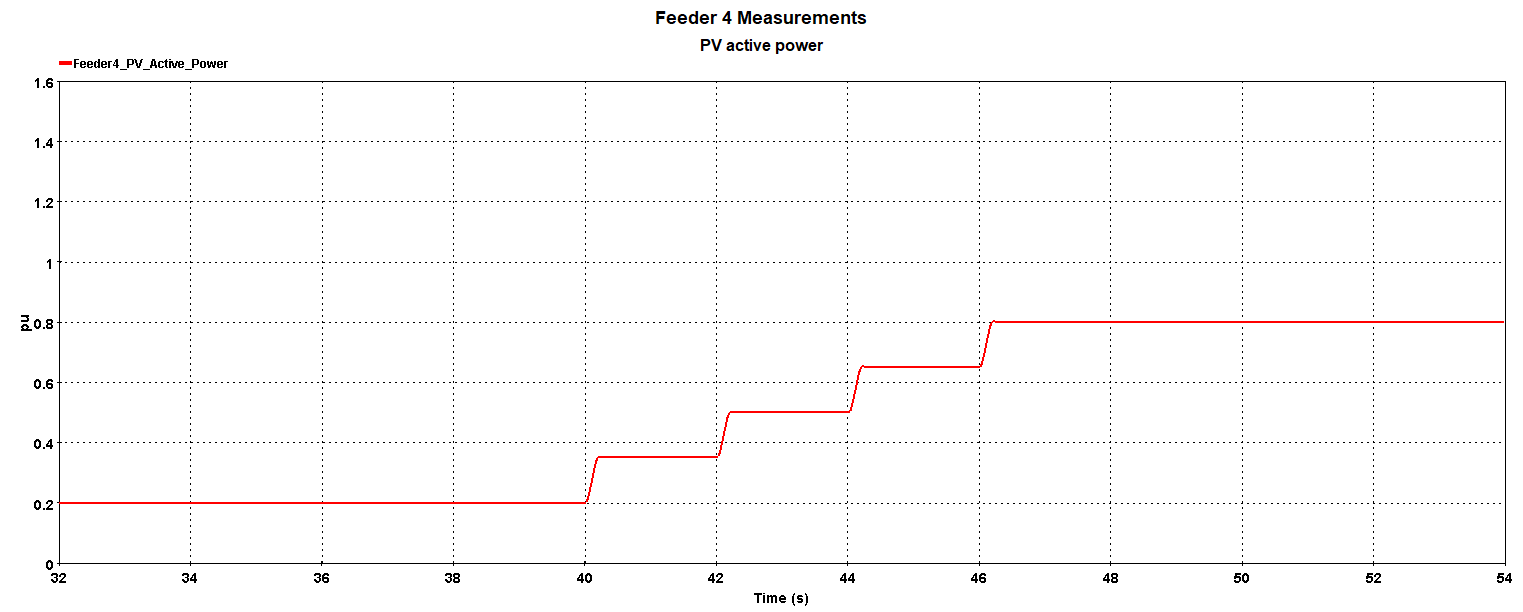
- At t = 40 s, the active power of PV at feeder 4 is increased from 0.2 pu to 0.8 pu in steps of 0.15 pu/2 s emulating an increase in the solar irradiance. This is similar to the power increasing from morning to noon.
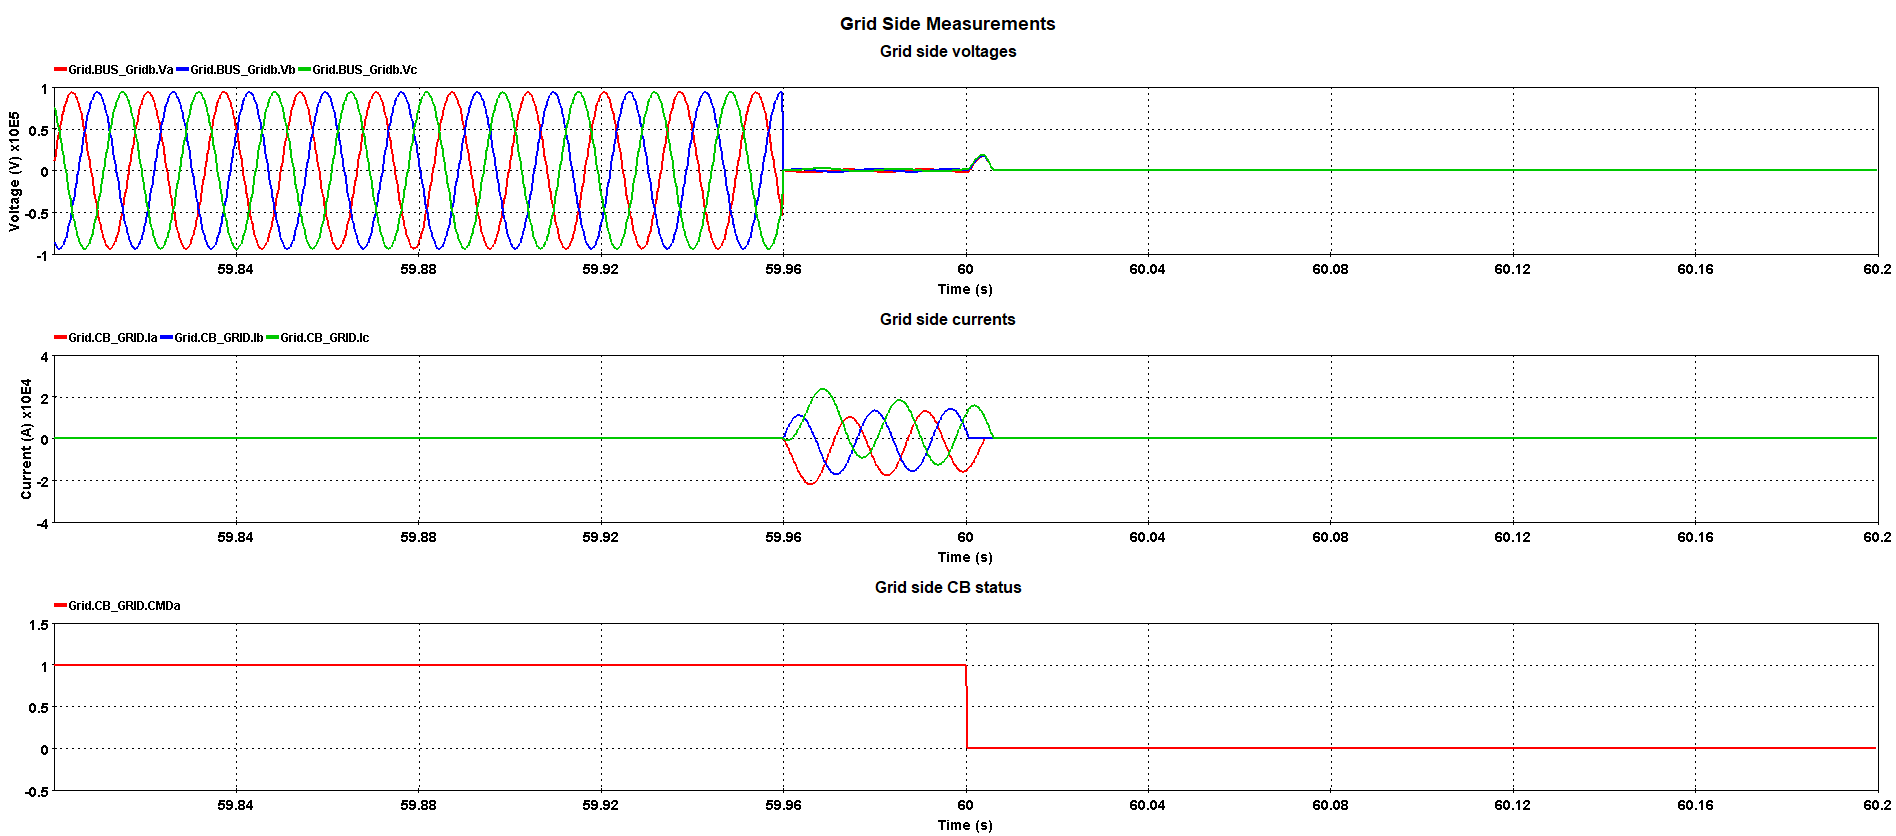
- At t = 59.96 s, a three-phase to ground (LLL-G) fault occurred at the grid side for a duration of 60ms.
- At t = 60 s, the PCC breakers of the feeders 1-3 open to isolate from the fault. This results in each feeder forming an islanded microgrid respectively: Feeder 1 island with the Diesel generator assuming the grid forming mode (voltage at 1pu and frequency at 60Hz); Feeder 2 island with BESS assuming the grid forming mode; Feeder 3 island with the CHP generator assuming the grid forming mode.
- At t = 65 s, an interruptible load of 600 kVA connected at Feeder 3 is disconnected to bring the CHP active power within 1p.u and to maintain the generation-load balance in the microgrid.
Results
The figures below show the results of the model under various scenarios.
Scenario 2: As the irradiance increases, the active power of PV connected at feeder 4 increases as shown in the figure below:
Scenario 3: Grid side fault and opening up of the breaker. The figure below shows the PCC voltages, currents and the circuit breaker status :
Scenarios 4-5: The PCC breakers of feeders 1-3 open at 60 s thus the feeders islanding into 3 microgrids. The figures below show the voltage, frequency, active power, reactive power and the PCC breaker status of each feeder. It can be seen for all the feeders that the network is stable and the voltage and frequency are well maintained in islanded modes.
Feeder 1:
After Feeder 1 PCC breaker opens, the Diesel Generator switches to grid forming mode. Its active power output changes from the previous setpoint 0.8 pu to 1 pu to supply the loads.
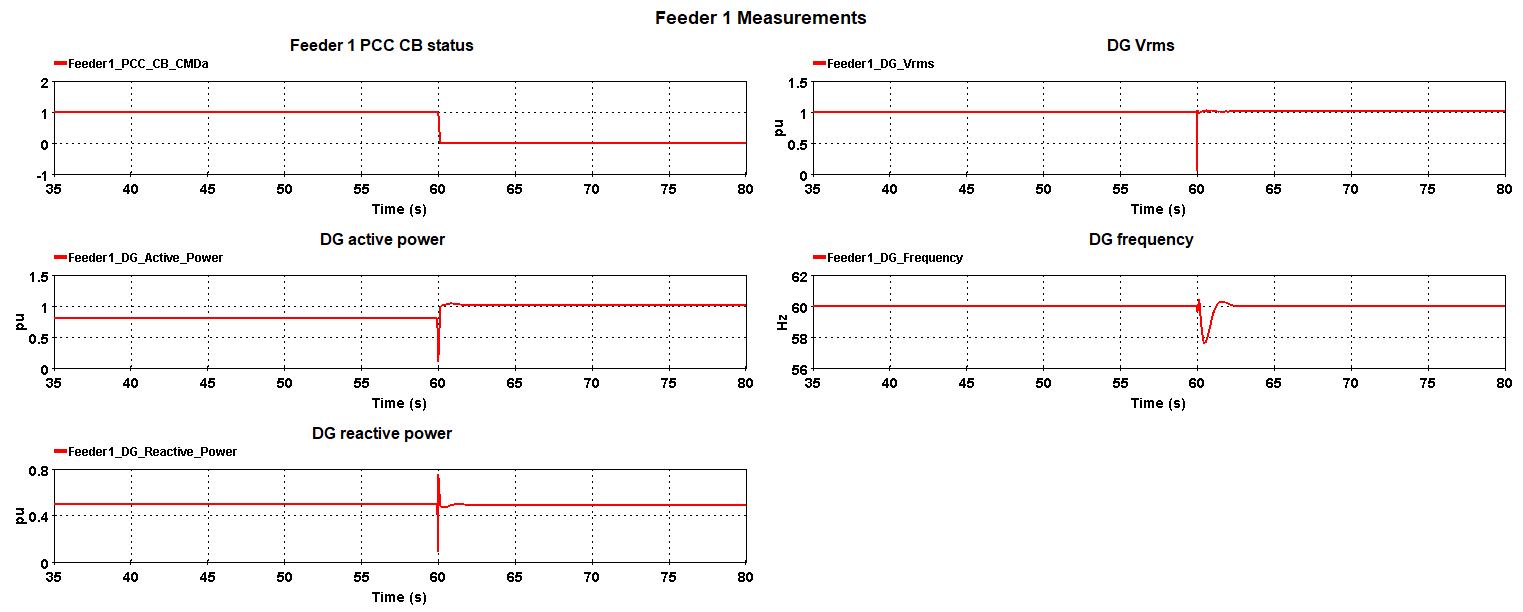
Zoom in of Feeder 1 measurements:![]()
Feeder 2:
When Feeder 2 turns into an island, BESS reduces its active power output from 0.8 pu to 0.21 pu since PV is generating at its maximum and the loads in Feeder 2 are well supplied. BESS increases the reactive power output to compensate for the voltage drop in the feeder.
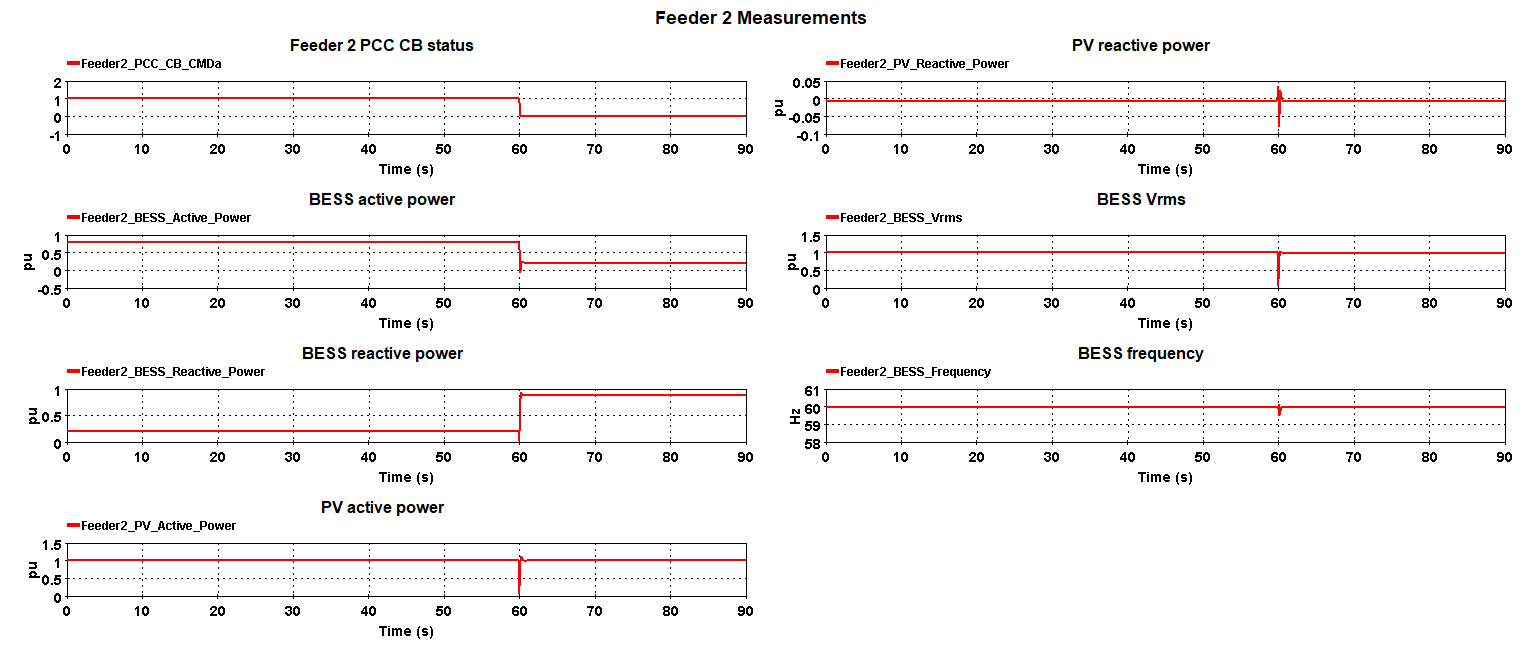
Zoom in of Feeder 2 measurements:
![]()
Feeder 3:
It can be seen that when during the initial islanded time, the active power demand of the generator exceeds slightly the 1 pu rating to 1.05 pu. A 600 kVA interruptible load is shed at 65 s to reduce the active power demand.
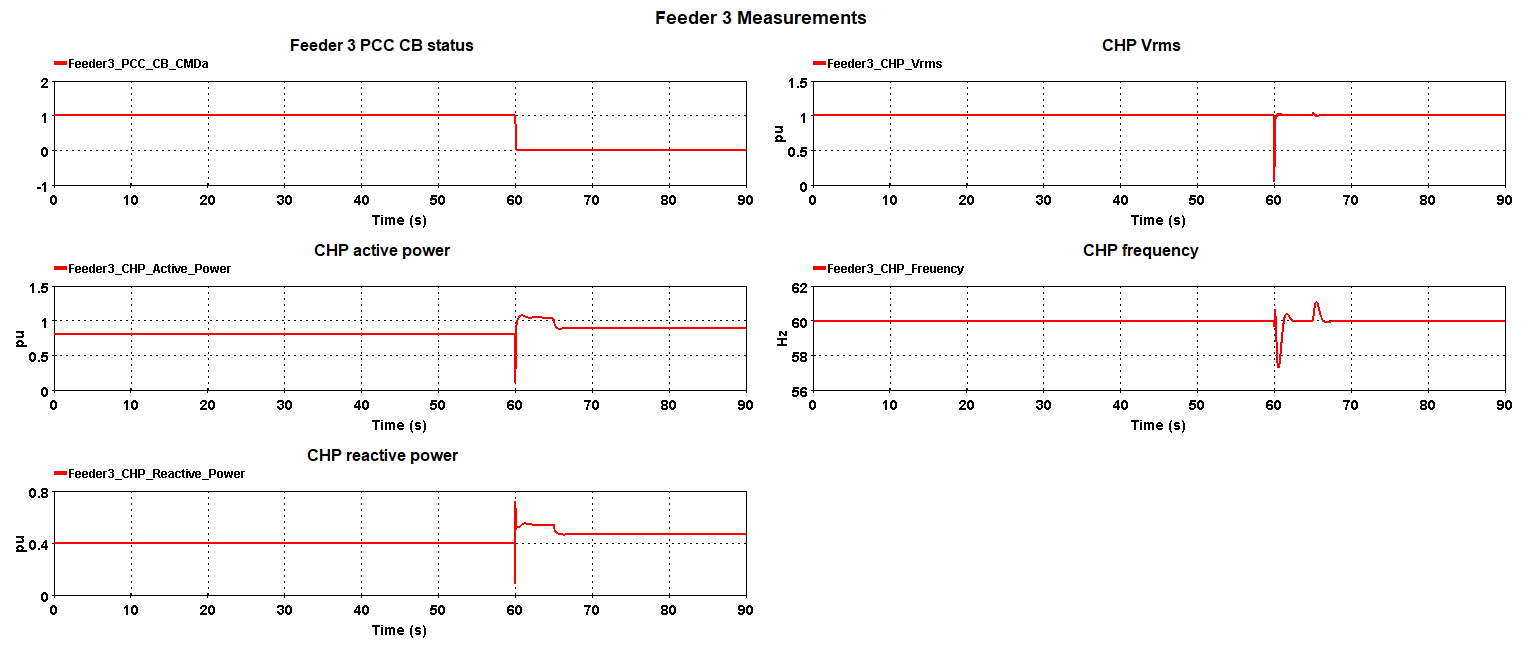
Zoom in of Feeder 3 measurements:
![]()
Feeder 4: The feeder 4 PV observes a transient at 60 s caused by the opening of the Feeder 3 PCC breaker. However, the PV controller quickly settles the system at the reference setpoint.
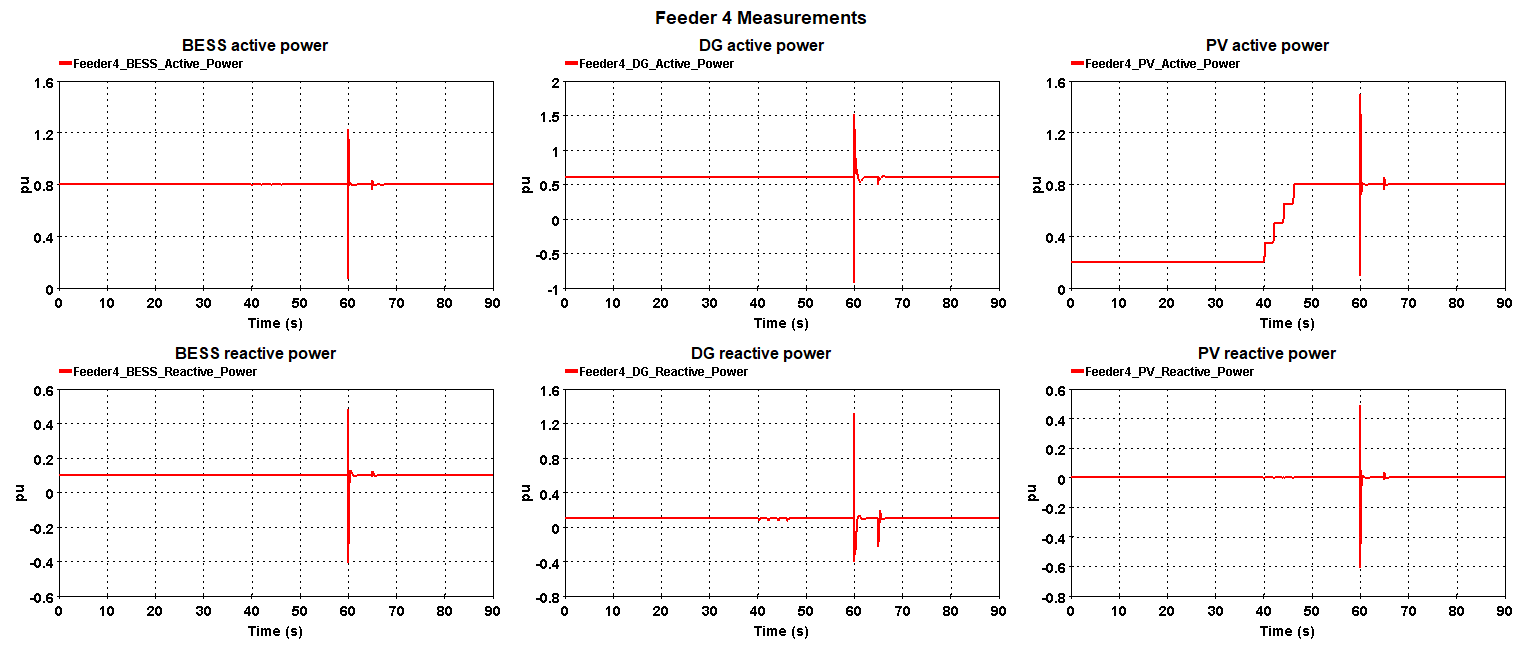
Zoom in of Feeder 4 measurements:
![]()
References
[1] 2017 Microgrid Controller Procurement Information Packet Volume 1.6, P. Koralewicz, ed.: NREL, 2017. [Online].
[2] R. Salcedo et al., "Banshee distribution network benchmark and prototyping platform for hardware-in-the-loop integration of microgrid and device controllers," in The Journal of Engineering, vol. 2019, no. 8, pp. 5365-5373, 8 2019.
OPAL-RT TECHNOLOGIES, Inc. | 1751, rue Richardson, bureau 1060 | Montréal, Québec Canada H3K 1G6 | opal-rt.com | +1 514-935-2323
Follow OPAL-RT: LinkedIn | Facebook | YouTube | X/Twitter