Documentation Home Page ◇ HYPERSIM Home Page
Pour la documentation en FRANÇAIS, utilisez l'outil de traduction de votre navigateur Chrome, Edge ou Safari. Voir un exemple.
Examples | Out of Step (OOS) Detection Using PMUs
- Sylvain Ménard
Location
This example model can be found in the software under the category "Protection" with the file name "Out_of_Step_Detection_50.ecf".
Description
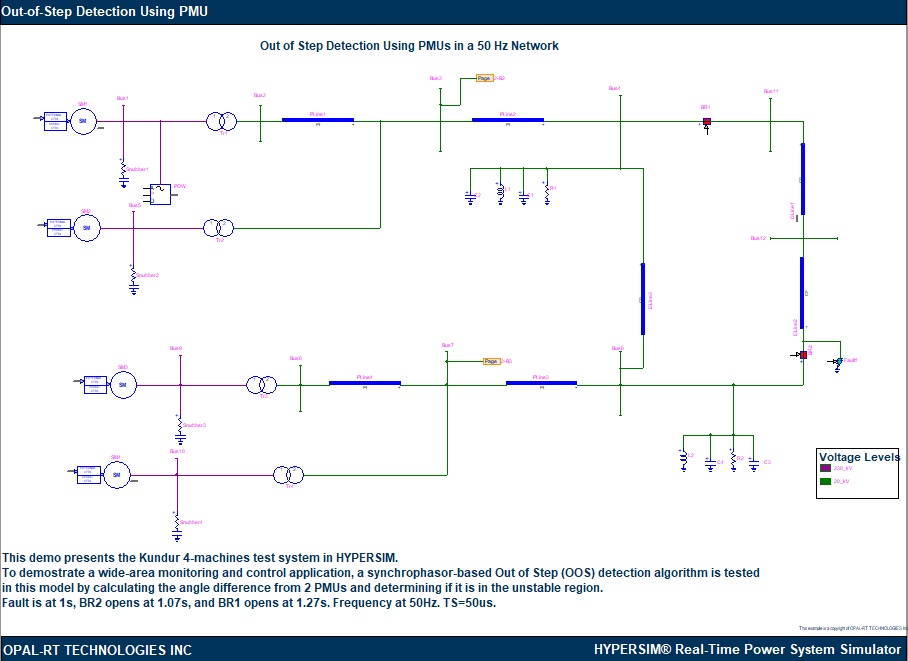
This example shows how to use synchrophasors in wide-area monitoring and control applications. The well-known 4-machine 2-area power system benchmark [1] is used as an example to test the Out-of-Step detection algorithm based on synchrophasors. Two PMUs are located in each area of the system and send synchrophasors to the Out-of-Step (OOS) detection component. The OOS detection component uses the positive sequence voltage synchrophasors from the two PMUs to calculate the slip frequency and the acceleration [2]. When the operating point is outside the stable region for 200ms, the OOS component asserts to indicate the unstable operating condition. The model runs in 50 Hz and for the fixed time step of 50 us.
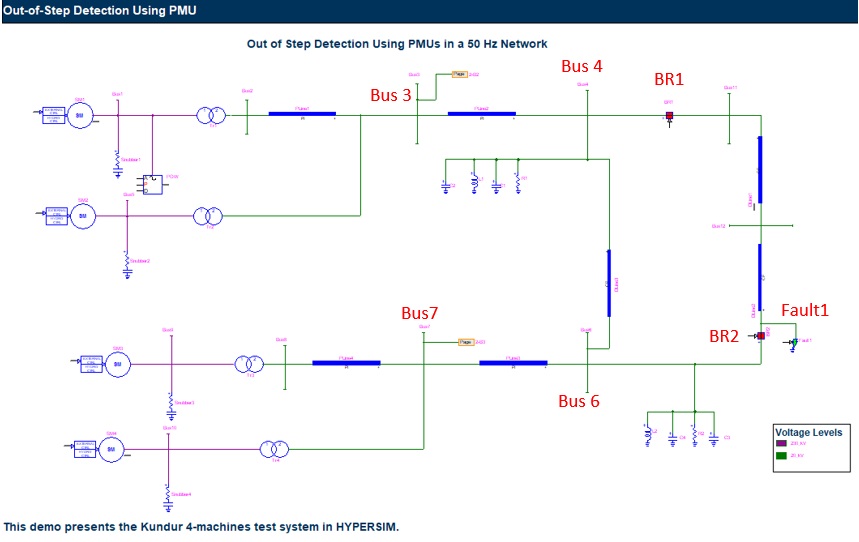
The example model has two pages. The first page "Power System" contains the 4-machine 2-area power system benchmark which is shown in the image below along with highlighted busbars and switches.
The second page P&C contains the PMU and the Out of Step (OOS) components.
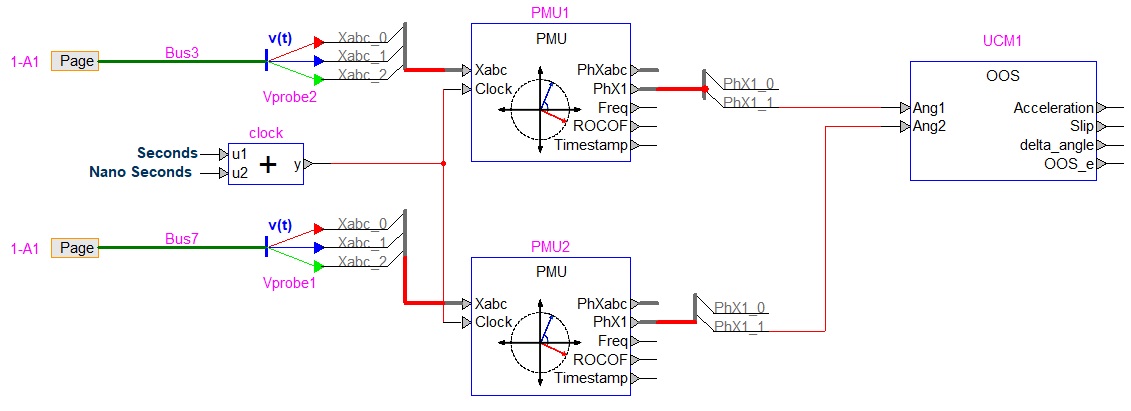
PMU1 and PMU2 are connected to Bus 3 and Bus 7 respectively. From each of the PMUs, the positive sequence voltage angle is sent to the OOS detection component. Both PMUs are configured as 50 Hz, P class, 50 frames per second.
PMU Component
The PMU (Phasor Measurement Unit) computes the three-phase and positive sequence phasors (magnitude and angle or real and imaginary), frequency, and the rate of change of frequency (ROCOF) from the input which is either the three-phase instantaneous currents or voltages. The time reference for the component can either be the simulation time or an external timing reference.
There are two different performance classes for the PMU component which can be chosen by the user: P class which features smaller response time and so is more suitable for protection applications, and M class which features higher accuracy and is more suited for measurement applications.
The reporting rate of the PMU determines the number of samples the PMU will output per cycle. The user can choose between 0.5, 1, and 2 S/cycle which corresponds to 25, 50, 100 S/s for a 50 Hz system and 30, 60, and 120 S/s for a 60 Hz system.
Lastly, users can choose whether the output phasor data of the PMU is in magnitude-angle or real-imaginary format along with the timing reference for the component.
For more information on the PMU used in this example model, refer to the its documentation: PMU (Based on IEEE Std C37.118.1 Annex C).
External Clock
If the simulator contains a syn1588 PCIe Oregano card, then an external clock can be used for synchronization and the option “External clock” can be chosen on the PMU. In this case, the input “Clock” needs appropriate signals which represent the master clock. Also, a Synchronization interface needs to be defined in the I/O Interface Configuration.
The “Seconds” and “Nanoseconds” data points of the Synchronization interface can be mapped to the input sensors of the “clock” in HYPERSIM which is an Add component here.
For more information on how to correctly configure the external clock, please refer to the PMU documentation.
In this example model, the “Internal Clock” is chosen for the simplicity of not requiring any additional modifications.
Out-of-Step Detection Component
The Out-of-step detection algorithm implemented in this example is based on PMU measurement [2].
The angle difference is defined as:
δ = ∠ V1PMU1 - ∠ V2PMU2
The slip frequency and the acceleration are calculated as follows respectively:
S = (Δδ)/(Δt)
A = (ΔS)/(Δt)
The sampling time of the OOS detection component is 15 ms.
The stable region is defined as bellow [2]:
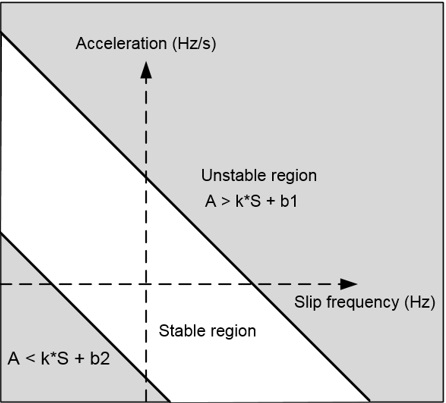
In this example, k = -15, b1=10, b2=-10. The time delay setting is 200 ms, which means if the operating point is outside the stable region for more than 200 ms, the OOS detection component is asserted.
Setup
Prerequisites
No prerequisites. A syn1588 PCIe Oregano card is optional.
Configuration
Hardware
If an external clock is to be used, refer to Oregano syn1588 | Configuration.
Software
The first step to running the simulation is to calculate the load flow. Since the model is running in 50 Hz, you have to make sure the frequency for load flow is also 50 Hz.
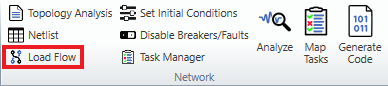
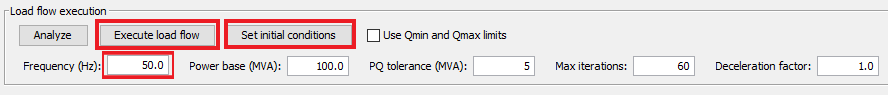
Step 1: Open Network -> Load Flow and make sure the frequency is 50 Hz. You don't have to execute load flow in this section.
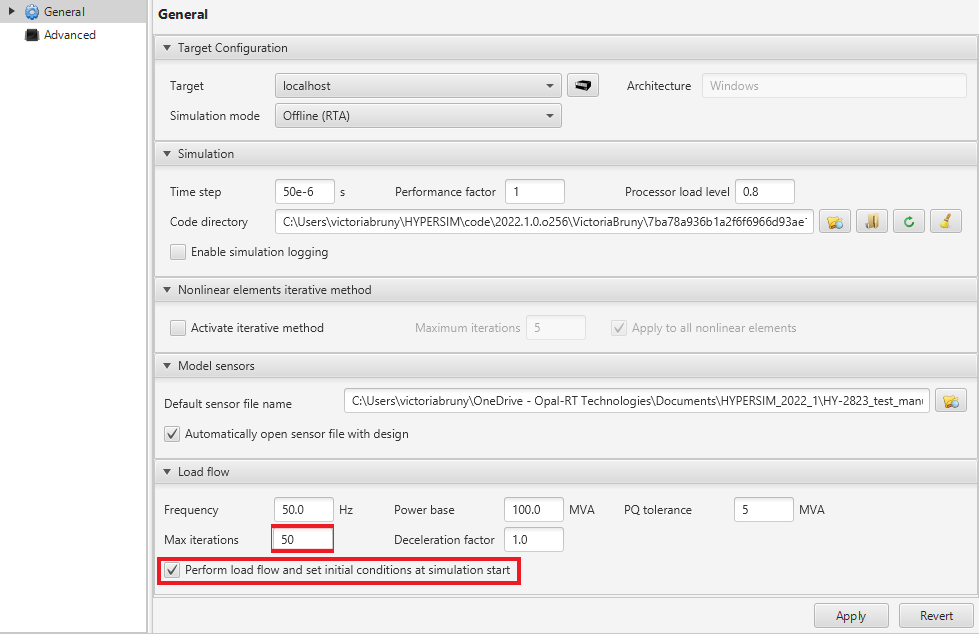
Step 2: Open Simulation Settings and enable the option "Perform load flow and set initial conditions at simulation start". Make sure the time step is set to 50 us. Select your target and run the simulation.

Simulation and Results
Test Scenario
We assume that the line distance protection at Bus 6 is configured to have a Zone 1 covering 80 % of the line with instantaneous tripping and a Zone 2 of 120 % with a time delay of 200 ms. The same setting is applied to the distance protection on the other end of the transmission line (at Bus 4). Please note that the distance protection is not modeled, but its operation is “emulated” by freely operating the breakers.
Since the fault occurs at almost 0% of the line, the distance protection at Bus 6 picks up the fault very fast and trip BR2. We assume that the distance protection picks up one cycle after the fault occurs and BR2 has a 50 ms opening time. This means that BR2 opens at t = 1.07 s.
If there is no transfer trip scheme implemented, the distance protection at Bus 4 should pick up the fault after a time delay of 200 ms and trip BR1. We assume that the distance protection picks up at t = 1.22 s and BR1 also has a 50 ms opening time. This means that BR1 opens at t = 1.27 s.
Make sure the simulation is started, open template “Out_of_Step_Detection_50.xml” in ScopeView. Check both Sync and Trig in the acquisition parameters, then click on Start in ScopeView to see the simulation results.
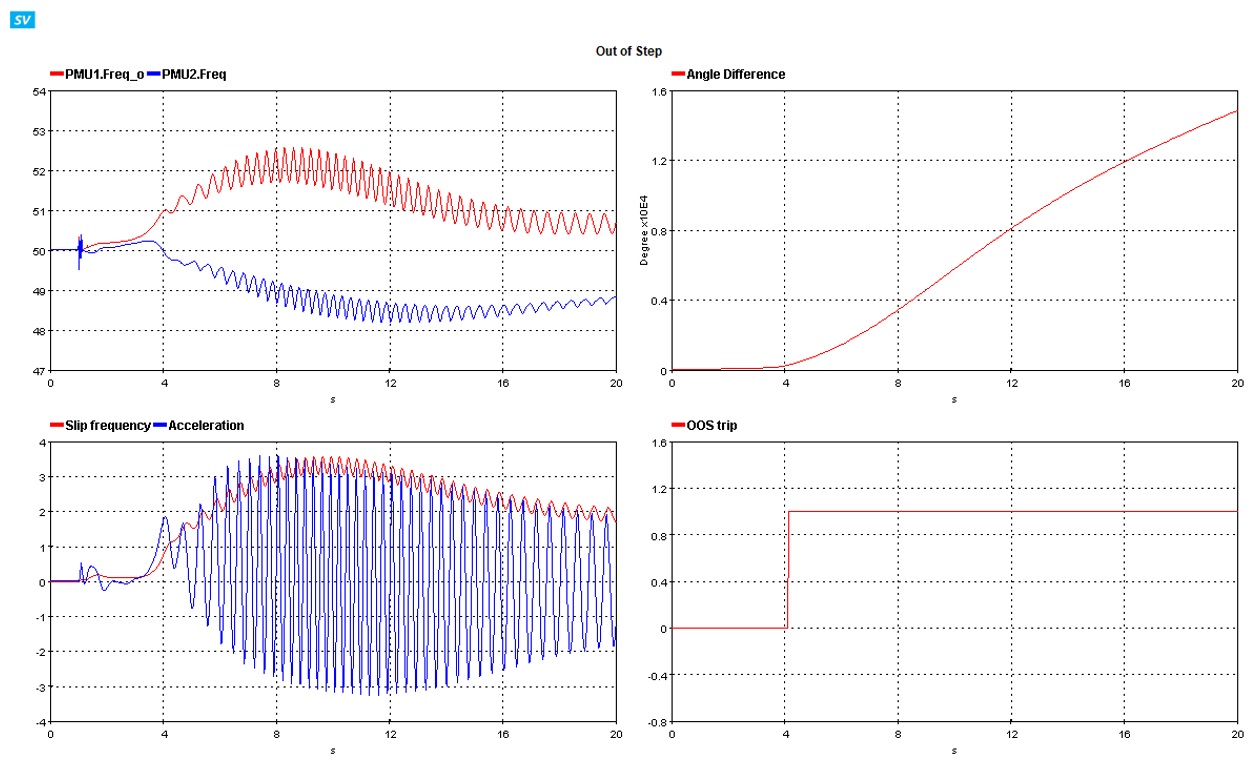
The Out of Step page of the ScopeView template is shown in the figure below, it can be seen that the angle difference between the two buses increases beyond 180 degrees and the frequency at both buses deviates from 50 Hz to the opposite directions.
The slip-acceleration trajectory plotted on the Slip VS Acceleration page (figure shown below) shows that the operating point goes outside the stable region after the fault and the breaker operation.
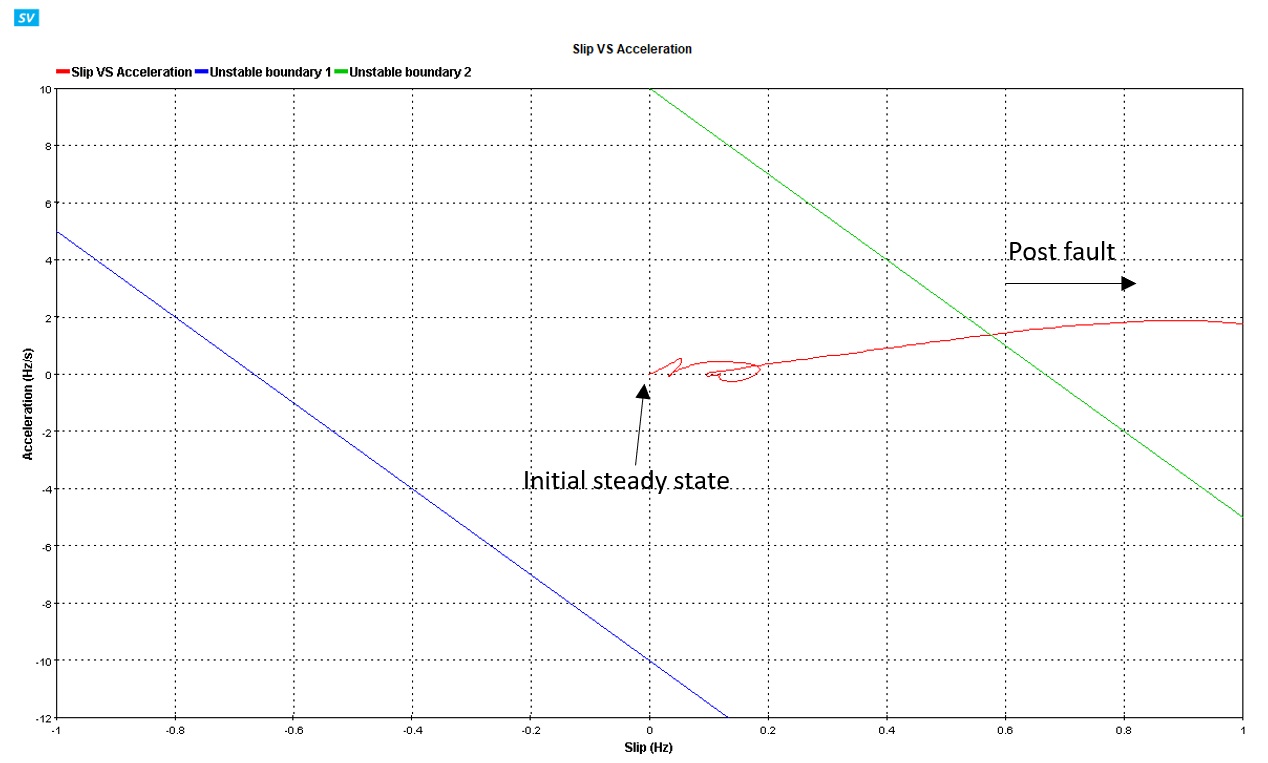
The OOS detection component is asserted at 4.09 s, which is 3.09 s after the fault occurs.
References
[1] Klein, M., G. J. Rogers, and P. Kundur. "A fundamental study of inter-area oscillations in power systems". IEEE Transactions on Power Systems 6.3 (1991): 914-921.
[2] Schweitzer, Edmund O., et al. "Advanced real-time synchrophasor applications." proceedings of the 35th Annual Western Protective Relay Conference, Spokane, WA. 2008.
OPAL-RT TECHNOLOGIES, Inc. | 1751, rue Richardson, bureau 1060 | Montréal, Québec Canada H3K 1G6 | opal-rt.com | +1 514-935-2323
Follow OPAL-RT: LinkedIn | Facebook | YouTube | X/Twitter