Documentation Home Page ◇ HYPERSIM Home Page
Pour la documentation en FRANÇAIS, utilisez l'outil de traduction de votre navigateur Chrome, Edge ou Safari. Voir un exemple.
Advanced | SISEUIL
- Sylvain Ménard
OVERSHOOT STATISTICS – [SISEUIL]
Compute overshoot statistics of a signal using a threshold condition.
CATEGORY
Advanced
DESCRIPTION
This function is used to compute overshoot statistics using a threshold condition. It also generates a logical signal with these overshoot times on the signal studied.
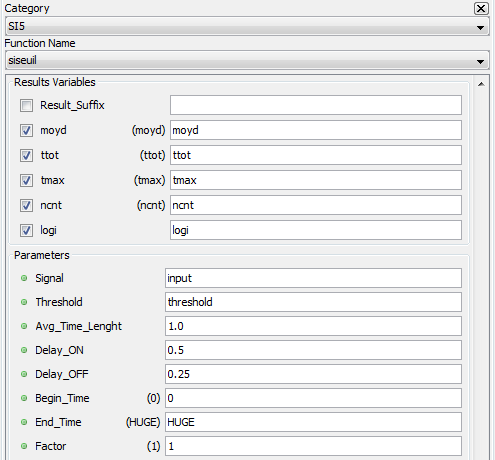
RESULT VARIABLES AND PARAMETERS
| Moyd | Sample mean computed on the first Time interval (Average Time Length) in milliseconds of the analyzed signal from the start of the signal. Afterwards, the signal overshoots are analyzed from the Starting time. |
| ttot | Sum of the overshoot times on the threshold value for the signal analyzed. This result is specified in milliseconds [ms]. |
| tmax | Longest overshoot time specified in milliseconds [ms]. |
| ncnt | Number of times when the threshold overshoot duration is longer than the specified Delay ON. |
| logi | The logical signal has a value of 1 from the start of an overshoot plus the Delay ON value. It remains at 1 until the end of the overshoot plus the specified Delay OFF value. For all other cases, the value of the logical signal is 0. The overshoot times which do not exceed the Delay ON value are not shown in the logical signal. |
| Threshold (+/-) | Difference with the mean of the starting samples to set the threshold value to reach. The threshold value used for overshoot calculations is the threshold difference added to the mean result (the mean of the time interval samples from the start of the study). This difference is expressed in the units of the signals.
|
| Average Time Length | Time interval in milliseconds [ms] from time 0 on which the initial mean will be computed and serving to set the threshold. A null value is not valid. |
| Delay ON | Minimal time during which the overshoot must last in order to be considered as a count. This time is specified in milliseconds [ms]. |
| Delay OFF | Minimal time during which the logical signal generated must stay at 1 following the end of an overshoot. This time is specified in milliseconds [ms]. |
| Begin_time | Time at which the analysis of a signal must start. This time is expressed in milliseconds [ms]. This value must be greater than 0 and lower than the duration of the test. The default value is 0. |
| End_time | Time at which the analysis of a signal must end. This time is expressed in milliseconds [ms]. The value of this time must be larger than the specified begin_time and smaller than the duration of the test. Use the “HUGE” value to specify the end of the test. The default value is HUGE. The begin_time and end_time specified for the calculation of the harmonics must be the same as those used in the sifreq sequences to compute the fundamental frequency. |
| Factor | Multiplying factor for the results generated by the function. The default value of the multiplying factor is 1.0 and has no effect on the results. The factor applies to the moyd, tmax and ttot results. |
SYNTAX
[moyd, ttot, tmax, ncnt, logi] = siseuil( input, 0.5, 1.0, 0.5, 0.25, 0, HUGE, 1)
CHARACTERISTICS
Data type support
Double Floating point
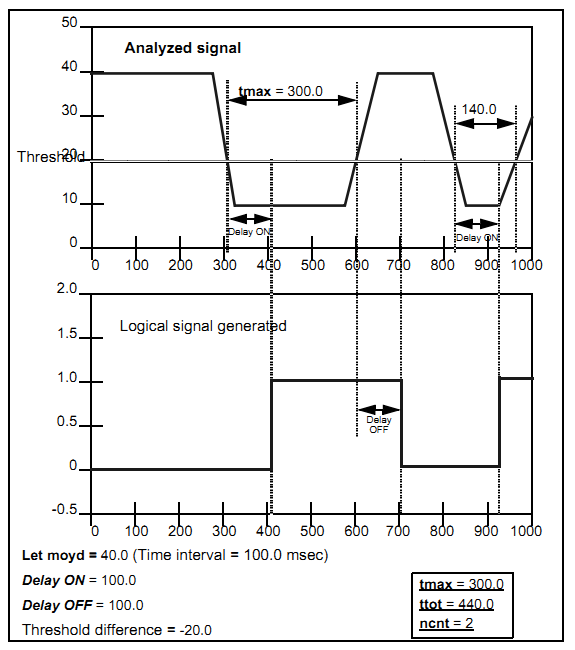
EXAMPLE
The first figure shows a case where the threshold difference is negative.
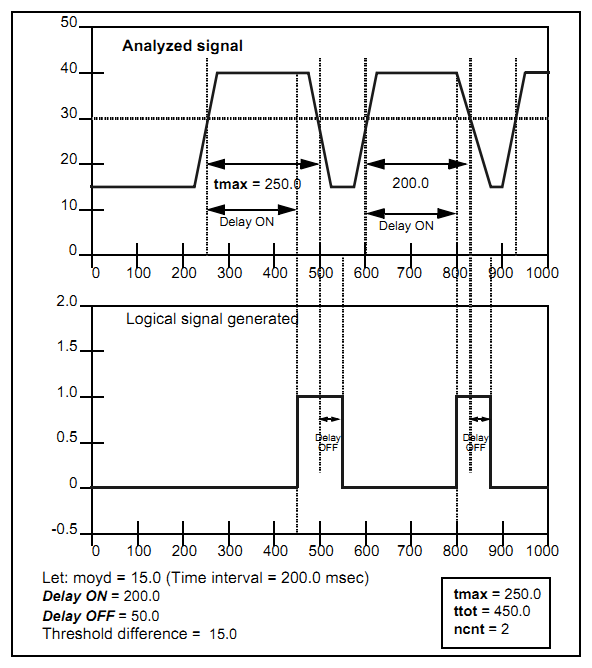
The second figure shows a case where the threshold difference is positive.
OPAL-RT TECHNOLOGIES, Inc. | 1751, rue Richardson, bureau 1060 | Montréal, Québec Canada H3K 1G6 | opal-rt.com | +1 514-935-2323
Follow OPAL-RT: LinkedIn | Facebook | YouTube | X/Twitter